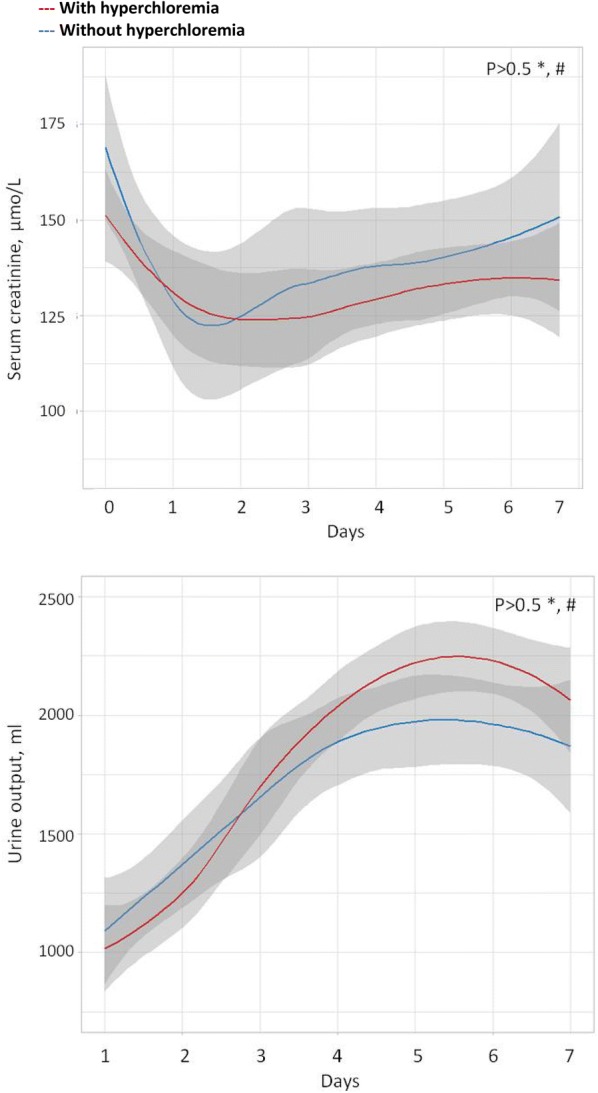
Fig. 2.

Evolution of renal function between patient with and without hyperchloremia from H0 to day-7 among patient free of RRT at H0. Means and 95% IC are provided. *p value for comparison at H0. #p value for comparison of the evolution over time (results of Generalized Non-Linear Mixed Model)
