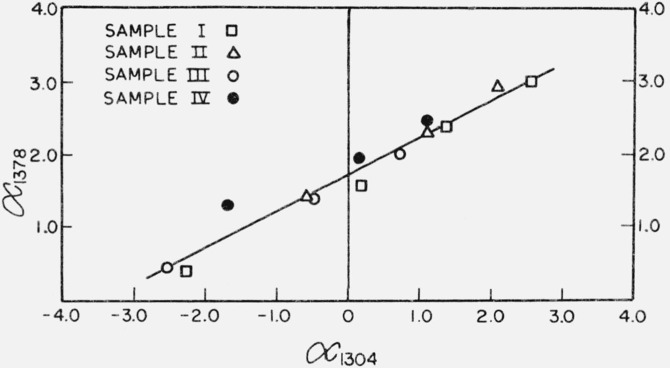
Figure 1. Ordinate: Absorptivity, α1378, cm2/g; Abscissa: Absorptivity, α1304, cm2/g.
The line shown in this graph represents a least squares fit of the absorptivity at 1378 cm−1 resulting from methyl groups against the absorptivity at 1304 cm−1 arising from amorphous methylene groups. The slope is equal to 0.51 ± 0.03 with the intercept at 1.74 ± 0.05 where the symbol ± stands for the standard deviation in these quantities inferred from the linear least-squares fit. The intercept represents the methyl absorption at perfect compensation for the methylene groups.

