Fig. 7.
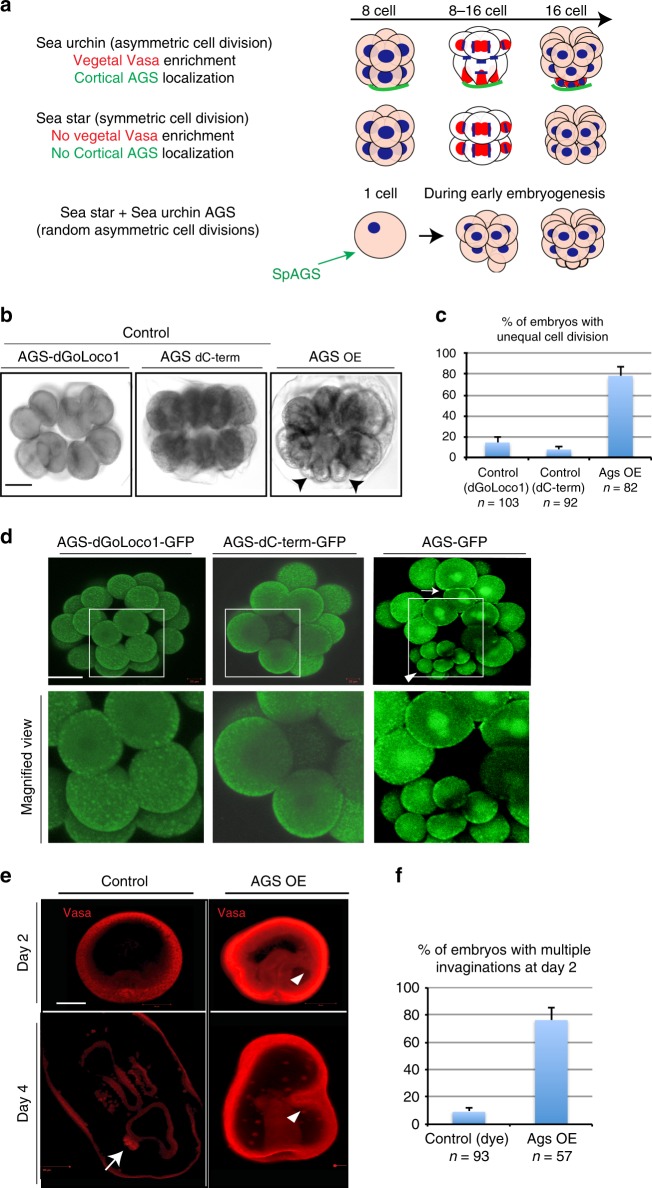
Sea urchin AGS induces asymmetric cell divisions during early embryogenesis and extra invaginations after blastulation in sea star embryos. a A summary diagram that depicts Vasa (red) and AGS (green) localization patterns during 8–16 cell stage. Sea urchin embryos undergo asymmetric cell division to form micromeres (organizers) accompanied by Vasa and AGS enrichment at the vegetal pole at 16-cell stage, whereas sea star embryos undergo symmetric cell division with no enrichment of either molecule. b–f Brightfield images (b), Live imaging (d), or Immunofluorescence images (e) of sea star embryos expressing 1.5 μg/μl stock of SpAGS-GFP mRNA that underwent random asymmetric cell divisions to form micromere-like cells during early embryogenesis (arrowheads in (b) and (d)) and extra invaginations at the larval stage (arrowheads in (e)). On the other hand, the controls injected with 1.5 μg/μl stock of SpAGS-dGoLoco#1 or SpAGS-dC-term that lacks GoLoco#1 or the entire C-terminal domain, respectively, or with dye underwent symmetric cell divisions (c) and single invagination (f). The number of embryos that underwent asymmetric cell divisions from 2- to 16-cell stage (c) or extra invagination at Day 2 (f) were scored and shown in %. n indicates the total number of embryos scored. In d, AGS-GFP was enriched on the spindle and at the cortex (arrow). White squared regions are enlarged in bottom row images. A white squared region is enlarged in the bottom row images. In e, Vasa (red) was enriched in the germline of the control larva (arrow), which was not found in the experimental group. n in the graphs c and f, indicates the total number of embryos scored. Each experiment was performed at least three independent times. Each image shows the representative phenotypes scored in the corresponding graph. Scale bars = 50 μm

