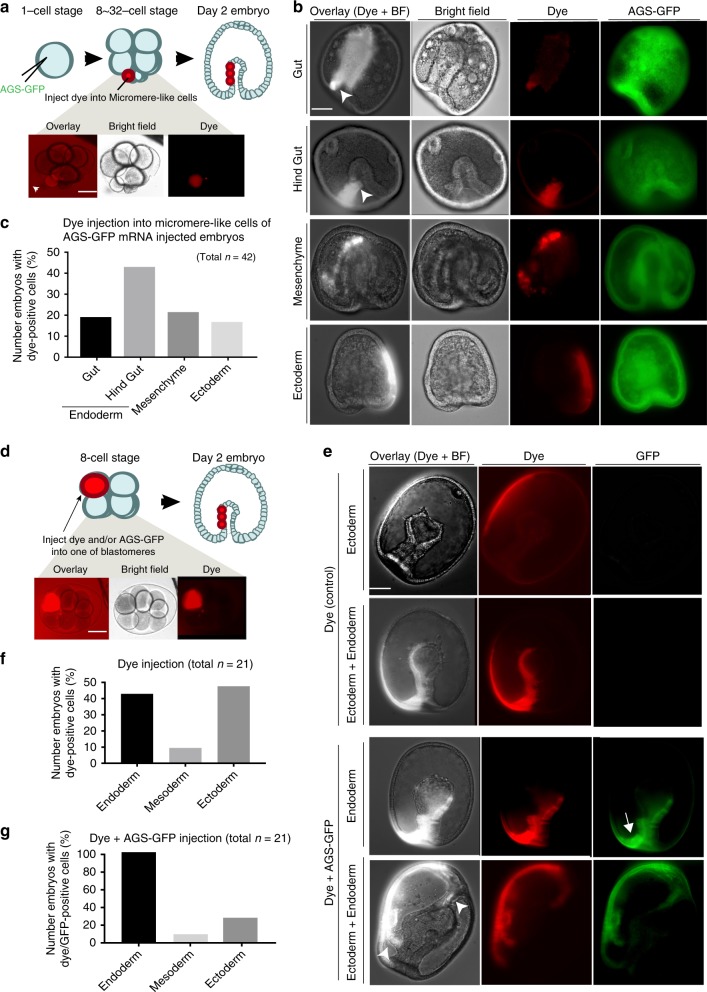
Fig. 8.
SpAGS-overexpression induces endo-mesodermal lineages in sea star embryos. a–c 1.5 μg/μl stock of SpAGS-GFP mRNA was injected into unfertilized eggs and the micromere-like cells were labeled with red fluorescent dextran (dye) during 8–32 cell stage (a). At Day 2, embryos were scored for each category based on where the dye signal was found (b, c). Arrows indicate the signal enrichment at the bottom of the gut. At the occasion when the signal was scattered in various tissues, the embryo was counted for each category. n indicates the total number of embryos scored. d–g 0.75 μg/μl stock of SpAGS-GFP mRNA or dye was injected into one of the blastomeres at the 8-cell stage (d). At Day 2 (e), embryos that were injected with dye (f) or with dye and SpAGS-GFP mRNA (g) were scored for each category based on where the dye signal was found. When the signal was scattered in various tissues, the embryo was scored in each lineage category. In e, arrow indicates AGS-GFP enrichment at the vegetal-most region of the gut and arrowheads indicate the signal enrichment of extra invaginations. n in the graphs f–g indicates the total number of embryos scored. Each experiment was performed at least three independent times. Each image shows the representative phenotypes scored in the corresponding graph. Scale bars = 50 μm

