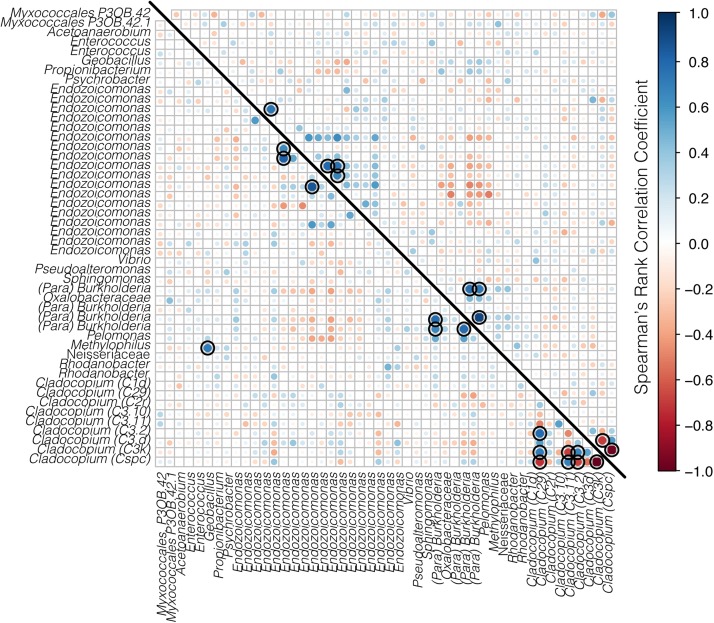
FIGURE 8.
Correlation matrix of both bacteria and Symbiodiniaceae for A. spathulata from Rib (below the diagonal line) and Davies reef (above the diagonal line). Bacterial taxa represent ASVs classified to genus where possible, and Symbiodiniaceae are represented by genus and sub-type. Positive correlations are represented in blue and negative correlations are represented in red, where both the size and the color of the dots represent the strength of the correlation. Black rings represent significant positive or negative correlations (p < 0.05).

