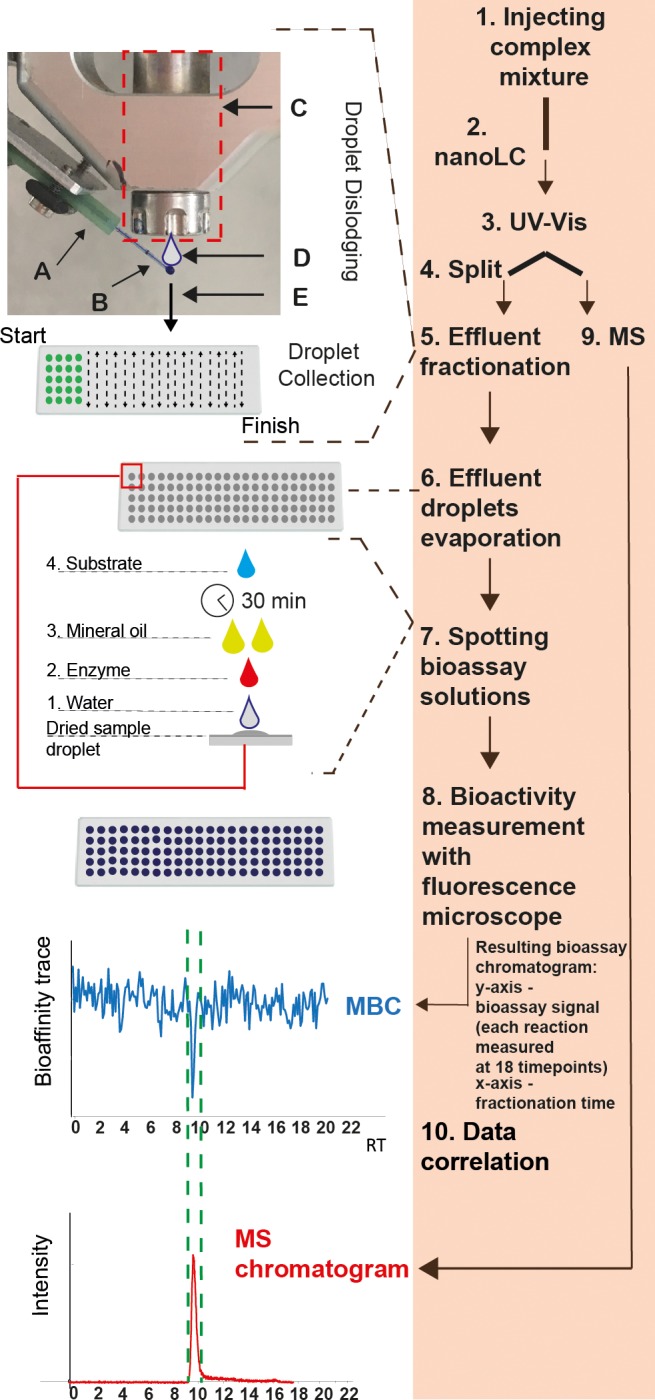
Figure 1.

Schematic representation of a picofractionation platform. Under orange shading (right side of the figure) the main steps of the picofractionation method are outlined: (1) a complex mixture is injected; (2) mixture separation on nanoLC column; (3) the eluting sample components are first measured with an ultraviolet–visible detector [UV–vis]; (4) split to picofractionation and MS; (5) effluent droplets are picofractionated (10-s fractions) and collected on a coated glass slide (A: nanoLC effluent is delivered by a glass capillary that is inserted into a fluorinated ethylene propylene (FEP) tubing sleeve mounted to an arm of a low volume liquid dispenser; (B) the glass capillary is protruding outside the sleeve tube and is positioned directly below the nozzle of the solenoid valve; (C) solenoid valve dispensing 100 nL of water; (D) water droplets ejected from the solenoid valve hit and merge “in flight” with the nanoLC effluent droplet (50 nL), dispensing them on a coated glass slide (E); (6) evaporation of collected nanoLC effluent droplets; (7) spotting of the bioassay solutions; (8) bioactivity measurement with fluorescence microscope; (9) mass spectrometric (MS) measurement; (10) bioactivity data and chemical data correlation. MBC = Microarray Bioactivity Chromatogram generated by plotting bioassay activity (slopes) over 18 measurements of individual droplets on y-axis and fractionation time on x-axis; RT = retention time; MS = mass spectrometry.
