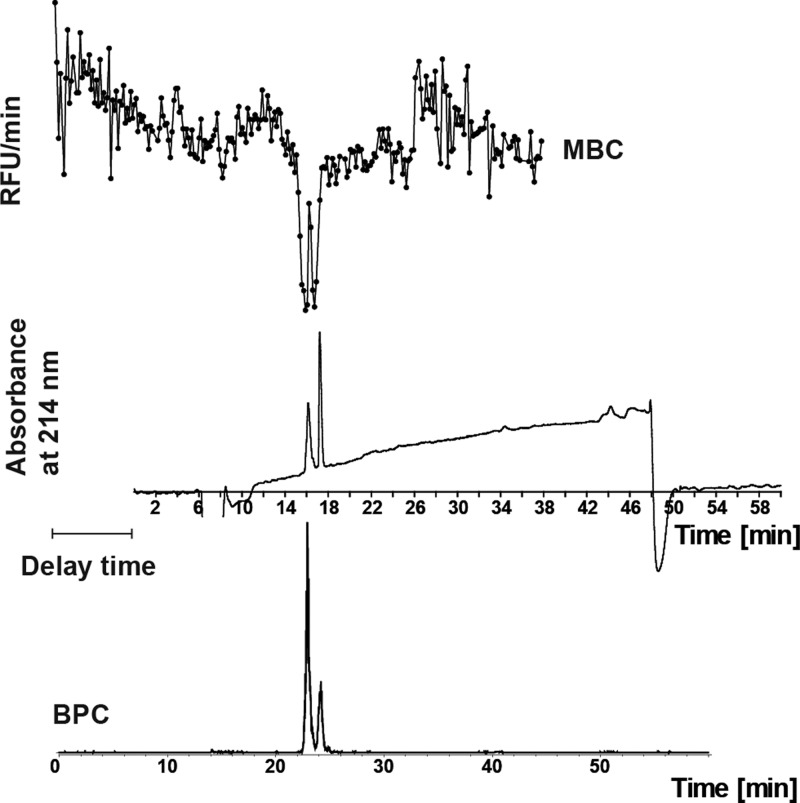
Figure 4.
Analysis of a mixture of leupeptin diastereoisomers (25 μM) using the picofractionation platform (top). The microarray bioassay chromatogram (MBC) was correlated with the UV absorbance trace (middle) and MS chromatogram (bottom). For MS analysis, leupeptin at a concentration of 2 μM was used. BPC: base peak chromatogram. For this analysis a long chromatographic gradient of 60 min was used.

