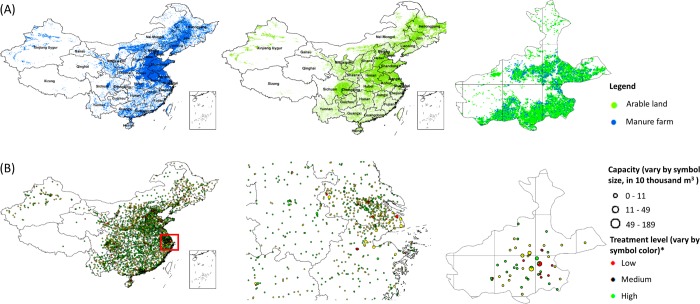
Figure 2.
(A) Locations of arable land and manure farms from land-use data (1 × 1 km) and an example of the polygon units with locations in the urban areas of Beijing. (B) The locations of WWTPs categorized by the daily average capacity (in 10 thousand m3) and the treatment efficiencies (%) for nitrogen (see Figure S4 for phosphorus). The detailed examples illustrate part of the coastal areas (indicated by the red box) and the urban areas of Beijing. Treatment levels include low (N removal rate ≤ 35%), medium (35%–55%) and high (≥55%) removal, following Van Drecht et al.45

