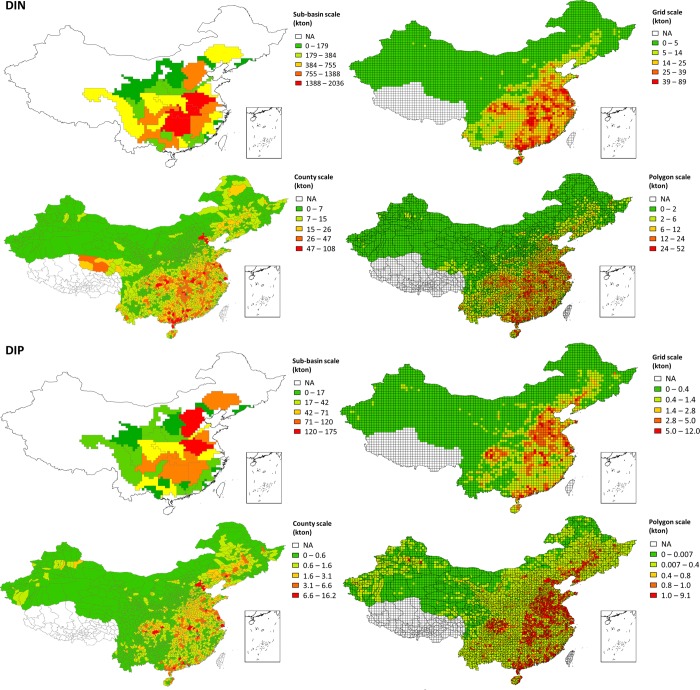
Figure 4.
Nitrogen and phosphorus inputs to rivers (kton year–1) in the year 2012 on multiple scales (sub-basin, grid, county, and polygon). The results are shown for dissolved inorganic nitrogen (DIN) and dissolved inorganic phosphorus (DIP). For dissolved organic nitrogen (DON) and dissolved organic phosphorus (DOP), see Figure S15. NA indicates regions for which detailed input data are not available.

