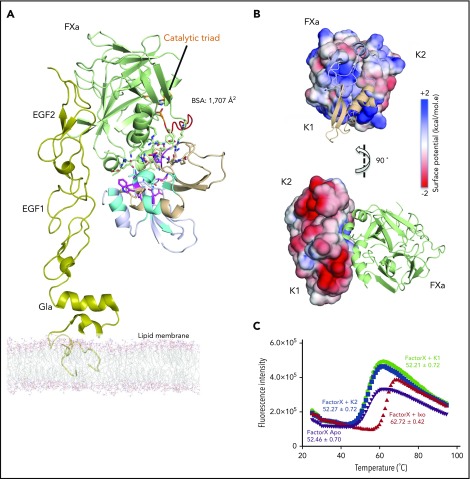
Figure 4.
Model structure of the Ixolaris-FXa complex. NMR data-driven HADDOCK model structure of Ixolaris bound to FXa. (A) Model with lowest HADDOCK score with FXa shown as green ribbon and Ixolaris as light blue and wheat ribbon. The model is based on the FXa structure (PDB accession code 1hcg) and the amino acids identified to interact with Ixolaris were used as active residues. The Ixolaris residues identified to interact with FXa using NMR CSP and peak intensity are shown as in Figure 3D. The orientation of membrane-associated FXa by the EGF and Gla domains is shown. The FXa catalytic triad (H57, D102, and S195) is shown as orange sticks. BSA, buried surface area. (B) Side view cartoon representations of the Ixolaris-FXa complex with the electrostatic potential at the solvent accessible surfaces shown for FXa (top) and Ixolaris (bottom). (C) Differential scanning fluorimetry of FX free state and FX bound state incubated with Ixolaris full-length, K1, and K2 constructs (molar ratio 1:1). Analysis of these melting curves with a first derivative method delivered the corresponding Tm values that were used to calculate the shifts (ΔTm).

