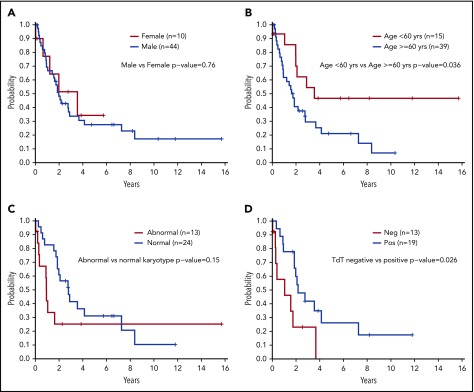
Figure 2.
Survival outcomes according to patient characteristics and molecular data. (A) OS according to sex (N = 54). (B) OS according to age ≥60 years or <60 years (N = 54). (C) OS according to normal karyotype vs abnormal karyotype (n = 37); excludes 17 unknowns. (D) OS according to presence of TdT staining at diagnosis positive (Pos) vs negative (Neg) (n = 32); excludes 22 unknowns. OS was compared between groups by using a log-rank test. All P values reported are 2-sided and considered significant if <.05.

