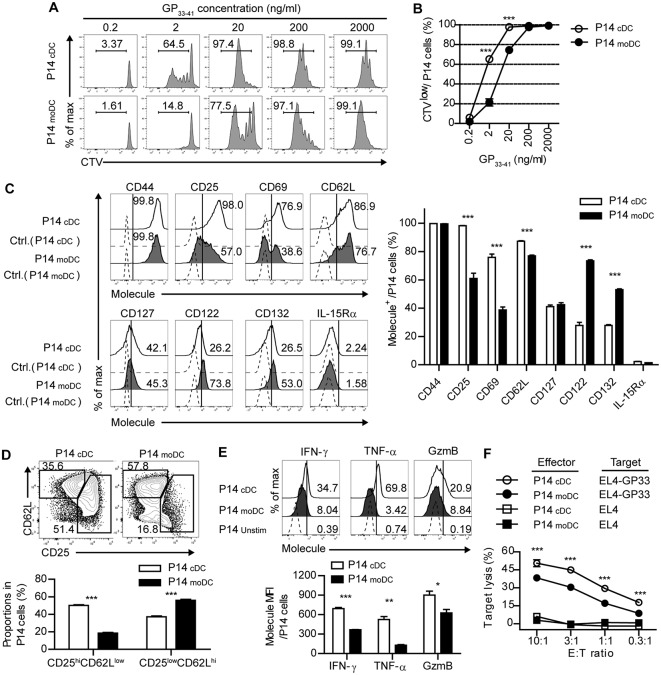
Figure 3.
CD8+ T cells primed by moDCs have reduced effector function than those primed by cDCs. (A,B) Representative histograms (A) and graph (B) of CTV dilutions in P14 cells primed by cDCs or moDCs in the presence of different doses of GP33−41 peptide for 3 days. Numbers in the histograms indicate the percentage of cells that were divided at least once. (C–F) P14 cells were activated by cDCs or moDCs in the presence of 0.2 μg/ml GP33−41 peptide for 3 days. (C) Expression levels of indicated surface molecules are shown as histograms (right) and a graph plot (left). Numbers in the histograms indicate the percentages of positive cells for each molecule. (D) Coexpression of CD25 and CD62L on P14 cells primed by cDCs or moDCs are shown as flow cytometry plots (upper) and graph (lower). Numbers in the plots indicate the percentages within each gate. (E) Secretion levels of the indicated effector molecules in P14 cells that were primed by cDCs or moDCs are shown as histograms (upper) and graph (lower). Numbers in the histograms indicate the percentages of positive cells for each molecule. (F) in vitro target killing ability of P14 cells primed by cDCs or moDCs. Cr51-labeled GP33−41-loaded EL4 tumor cells were used as the target cells. Data are representative of three independent experiments and are shown as the mean ± SEM. *p < 0.05;**p < 0.01; ***p < 0.001.

