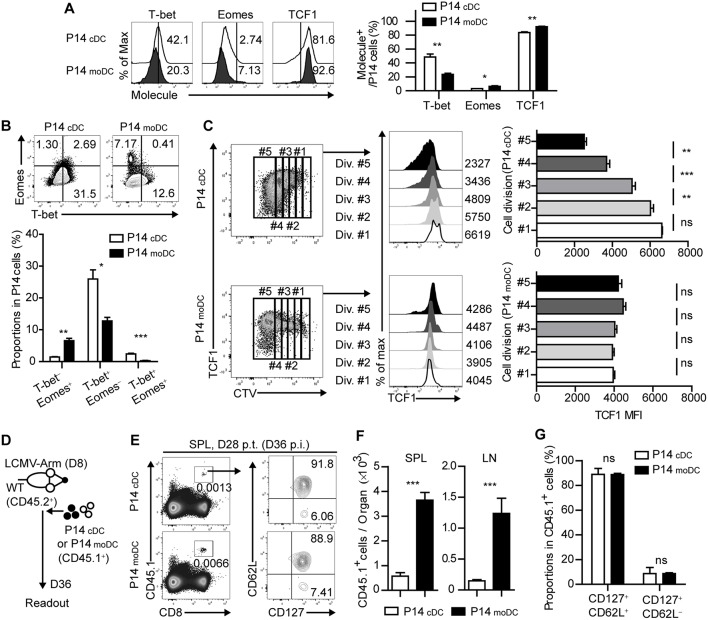
Figure 4.
Stimulation by moDCs dictates the developmental program of memory CD8+ T cells by transcriptional regulation. (A) Expression levels of the indicated transcription factors in P14 cells primed by cDCs or moDCs are shown as histograms (upper) and graph (lower). Numbers in the histograms indicate the percentages of positive cells for each molecule. (B) Coexpressions of T-bet and Eomes in P14 cells primed by cDCs or moDCs are shown as flow cytometry plots (upper) and graph (lower). Numbers in the plots indicate the percentages of the cells in each quadrant. (C) P14 cells primed by cDCs or moDCs were gated by their cell division (left). TCF1 expression levels of each gate are shown as histograms (center) and graphs (right). Numbers in the histograms indicate the MFI values of TCF1 expression in each gate. (D–G) CD45.1+ P14 cells were primed in vitro by cDCs or moDCs, transferred to infected recipient mice on day 8 p.i., and analyzed on day 28 post transfer. (D) Experimental schedule. (E) Representative flow cytometry plots of donor cells in the spleens of recipient mice. (F) Graphs show the number of donor P14 cells in the indicated organs. (G) Graphs show the coexpressions of CD127 and CD62L of the donor cells in the spleen of the recipient mice. Data are representative of two or three independent experiments and are shown as the mean ± SEM. *p < 0.05; **p < 0.01; ***p < 0.001.

