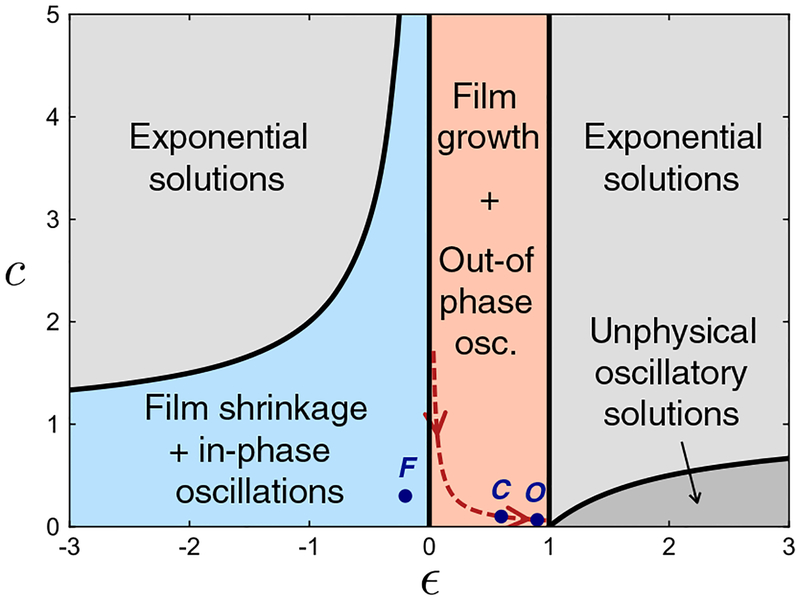
FIG. 4.
Phase diagram of behavioral regimes, where ∈ = μ/kr and c = kr/kt. Phase boundaries are represented by solid black lines; those that are curved obey c = 1 – ∊−1. Blue and orange shaded regions may pertain to morphogenesis. Dark blue dots labeled C, O, and F indicate parameter values used to make the cerebellum, organoid, and fovea plots, respectively, in Fig. 2. The red dashed line (given by c = 0.06/∊) indicates one possible trajectory of cerebellar and organoid morphogenesis, associated with kr decreasing over time.

