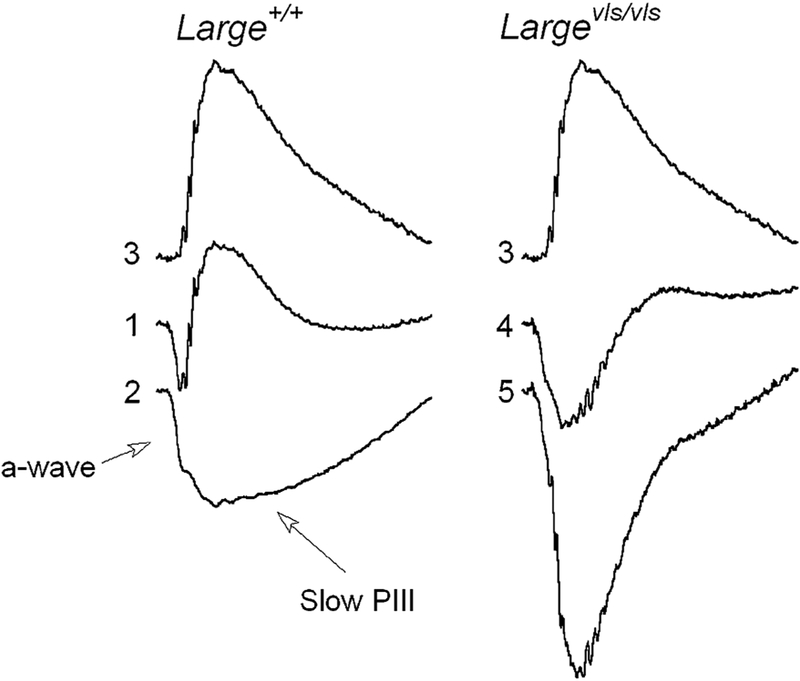
Fig. 2.
Predicted result if changes in response properties of slow PIII underlie abnormal Largevls ERG waveform. Responses (1) and (2) were evoked by 0.0 log cd s/m2 stimulus flashes from control (1) and Gpr179nob5/nob5 (2) mice. Response (3) represents the result of subtracting response (2) from response (1). Response (4) was evoked by 0.0 log cd s/m2 stimuli from a Largevls/vls mouse. Response (5) indicates the result of subtracting response (3) from response (4) and represents the waveform expected if Largevls/vls ERGs include a normal waveform P2 component. All responses are normalized to a-wave at 24 ms, corresponding to the trough of response (1)

