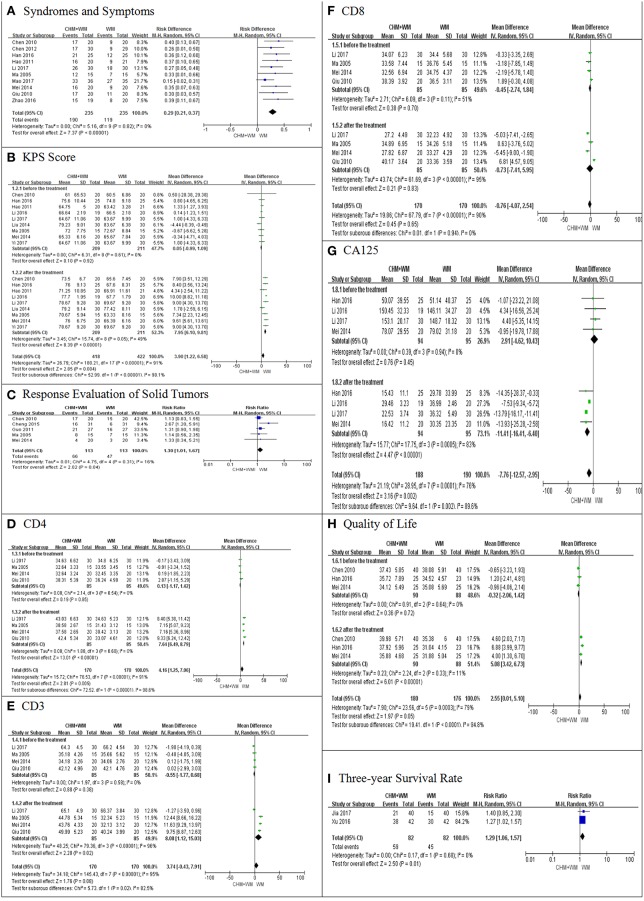
Figure 2.
Meta-analysis on efficacy. (A–I) showed the comparisons and meta-analyses on efficacy between CHM-WM group and WM group. The I2 statistic described the percentage of total variation across studies that was due to heterogeneity rather than chance. CI indicated the confidence interval. Dichotomous data were presented as pooled Risk Ratio (RR) with 95% confidence intervals (95% CIs), while continuous data were presented as Mean Difference (MD) with 95% CIs.

