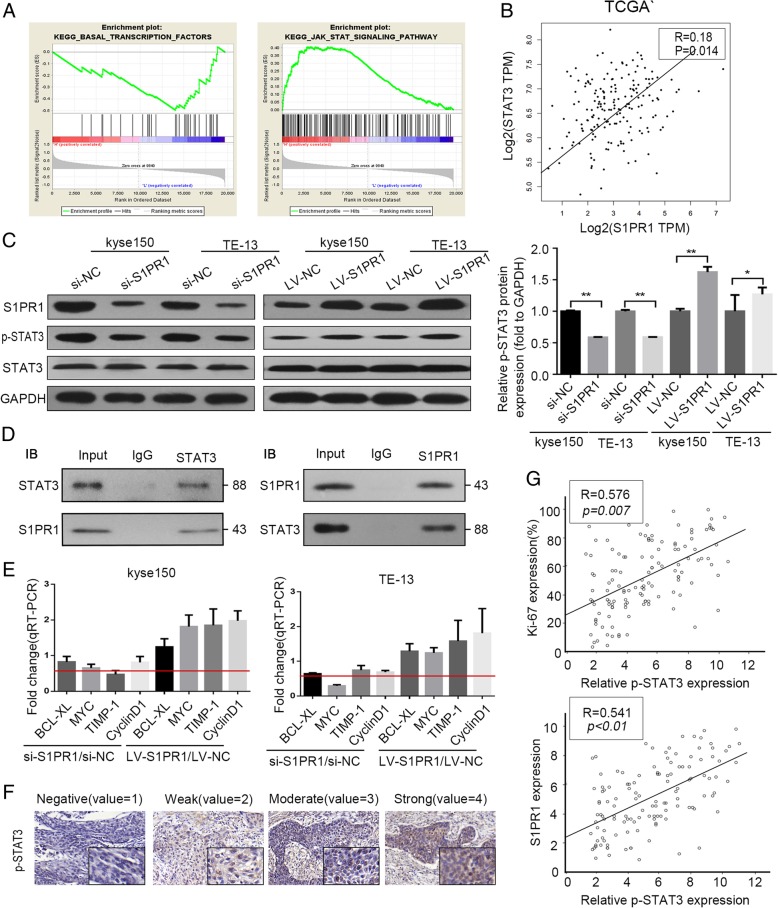
Fig. 4.
The interaction of S1PR1 with STAT3 and the expressions of STAT3-mediated transcription downstream targets. a GSEA plot indicating a significant correlation between the mRNA level of S1PR1 expression and the STAT3-activated signatures in TCGA ESCC specimen. b S1PR1 and STAT3 mRNA expressions from TCGA database of ESCC patients. c Western blot analysis of S1PR1, p-STAT3, total STAT3 and GAPDH in kyse150 and TE-13 cells with S1PR1 knockdown or overexpression. d Co-immunoprecipitation experiments were conducted on TE-13 cell lysates with anti-S1PR1and anti-STAT3, and then the precipitation was subsequently analyzed by western blotting with anti-STAT3 and anti-S1PR1. e QRT-PCR analysis of BCL-XL, myc, Timp-1, and cyclinD1 mRNA in kyse150 and TE-13 cells with S1PR1 knockdown or overexpression. f Representative images from immunohistochemically staining of p-STAT3 in ESCC patient tissues. g Spearman correlation analysis of the expression of p-STAT3 and expression of S1PR1 and Ki-67 in ESCC tissues. Statistical significance was determined by Student’s t test. p < 0.05

