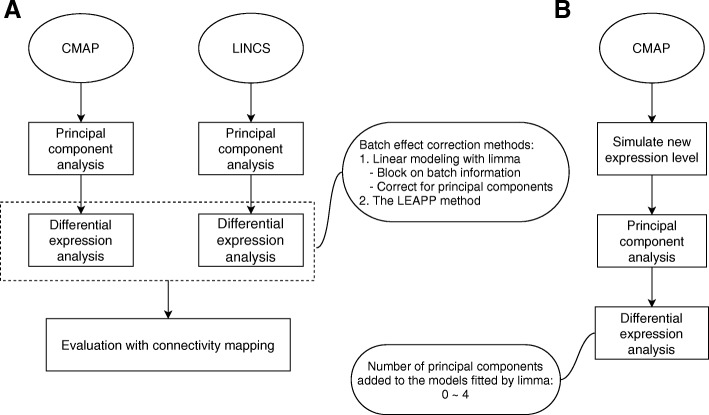
Fig. 1.
Overall workflow of the study. a, workflow of real data analysis. CMAP and LINCS datasets are analyzed by principal component analysis, followed by differential expression analysis with several batch effect correction methods, which were then evaluated by connectivity mapping (the procedure of connectivity mapping is illustrated by Additional file 2: Figure S2); b, workflow of simulation analysis. Expression data were simulated from CMAP dataset, and the optimal number of largest principal components being corrected for was assessed

