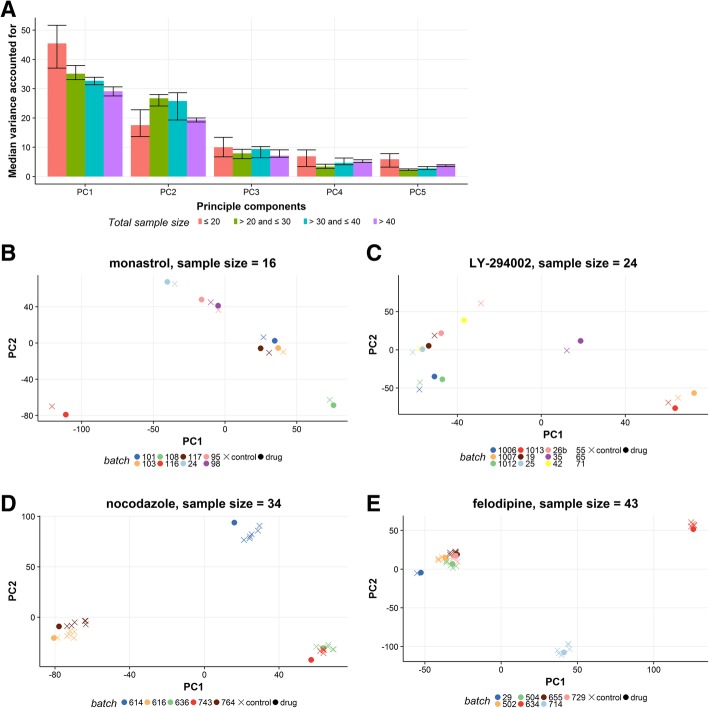
Fig. 3.
Results of principal component analysis on expression matrices for CMAP dataset. a, Median variance accounted for by the four largest principal components grouped by total sample size. b-e, Score plots of the first two principal components for four typical drugs; colors indicate batch (plate id) and shapes indicate drug or control status

