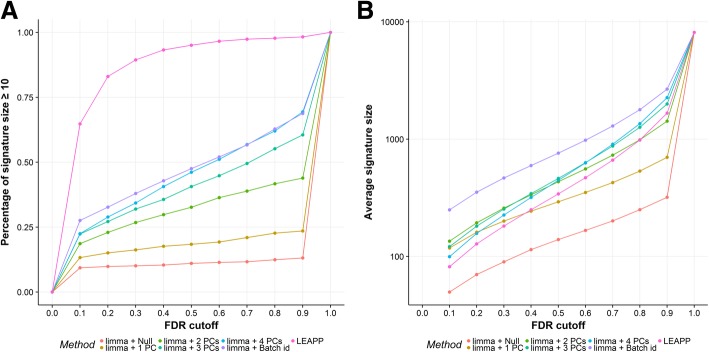
Fig. 4.
Results of differential expression analysis on CMAP dataset. a, percentage of drugs having signature size greater than or equal to 10 for each gene expression analysis method plotted against FDR cutoff. b, average signature size resulted from each gene expression analysis method plotted against FDR cutoff; y-axis was transformed to log-10 scale

