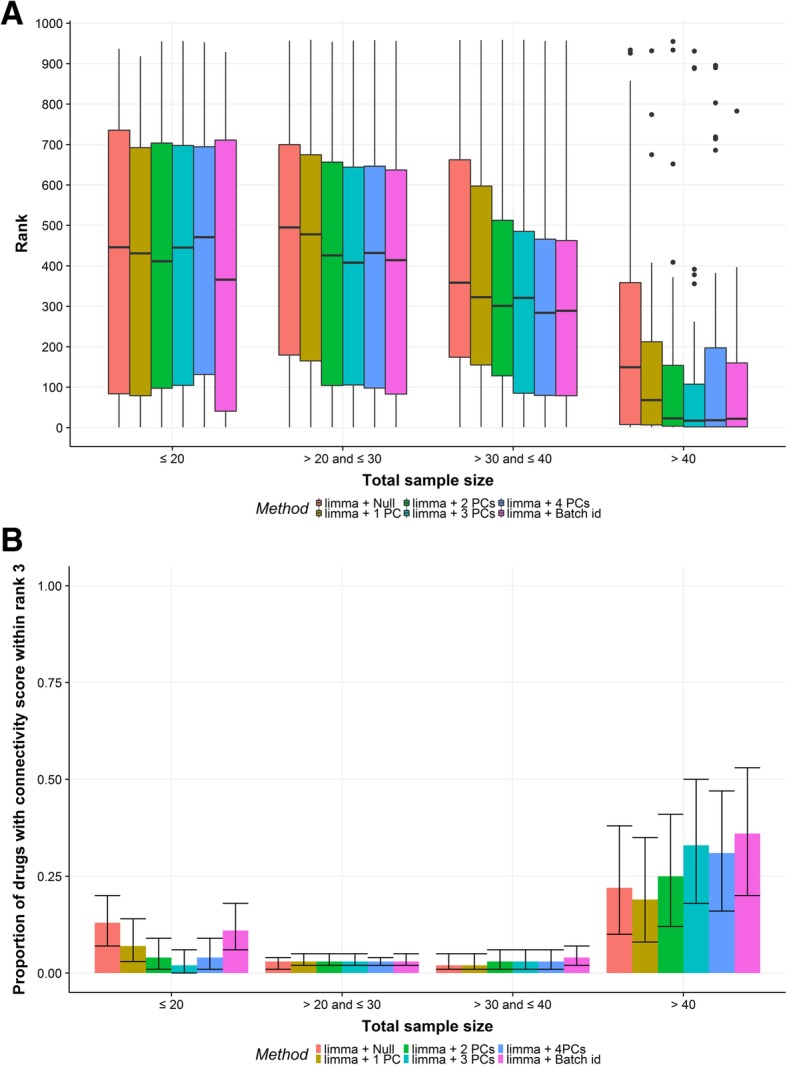
Fig. 5.

Results of connectivity score analysis with a fixed number of 15 genes with lowest FDR. a, Boxplot of the ranks of the same drug in connectivity mapping between CMAP and LINCS dataset. b, The proportion of drugs having the same drug ranked within top 3 in connectivity mapping between shared genes of CMAP and LINCS dataset. The x-axes are grouped by the total sample size in CMAP dataset. The colors indicate the differential gene expression analysis methods
