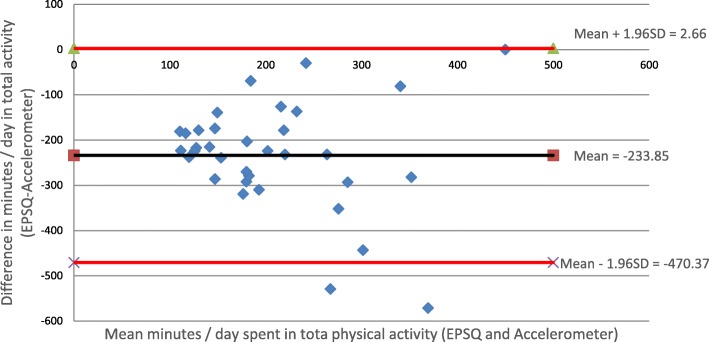
Fig. 1.
Bland-Altman plot showing difference versus average values of self-reported (EPSQ) and objectively measured (Accelerometer) total physical activity. The plots show discrepancy with 95% limits of agreement in patients (n = 34). Negative values indicate under-reporting of PA on the self-report measure (EPSQ)

