Fig. 4.

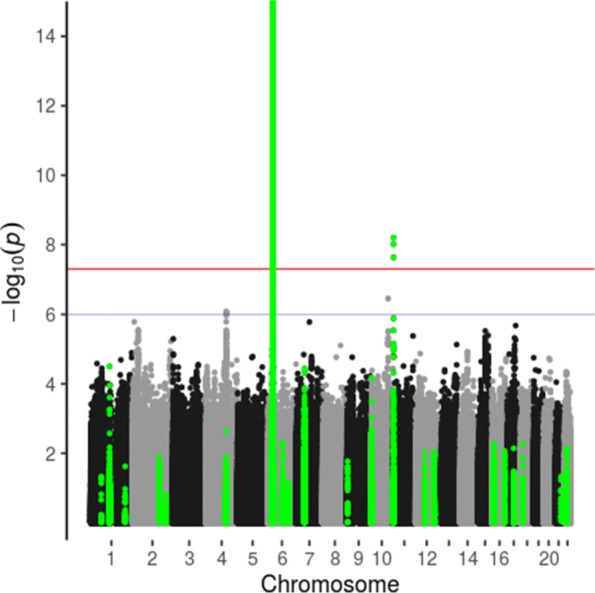
Manhattan plot of genome-wide association study of C-peptide levels, adjusted for age at onset, duration and predicted age at onset given genotype (vertical axis truncated at 15). Type 1 diabetes-associated regions in green

Manhattan plot of genome-wide association study of C-peptide levels, adjusted for age at onset, duration and predicted age at onset given genotype (vertical axis truncated at 15). Type 1 diabetes-associated regions in green