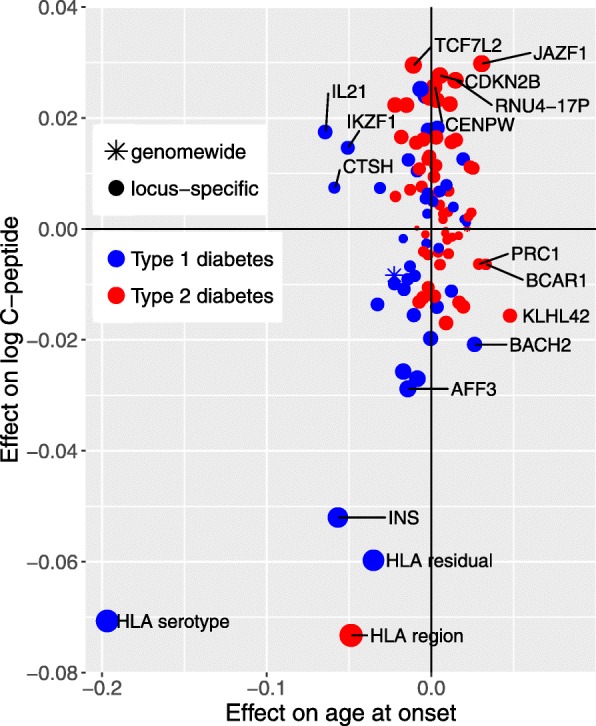
Fig. 5.

Locus-specific genotypic scores for type 1 or type 2 diabetes: plot of univariate effects on log10 C-peptide (adjusted for age at onset and duration) against univariate effect on square root age at onset. Effect sizes are the effect of a change of one standard deviation in each locus-specific score
