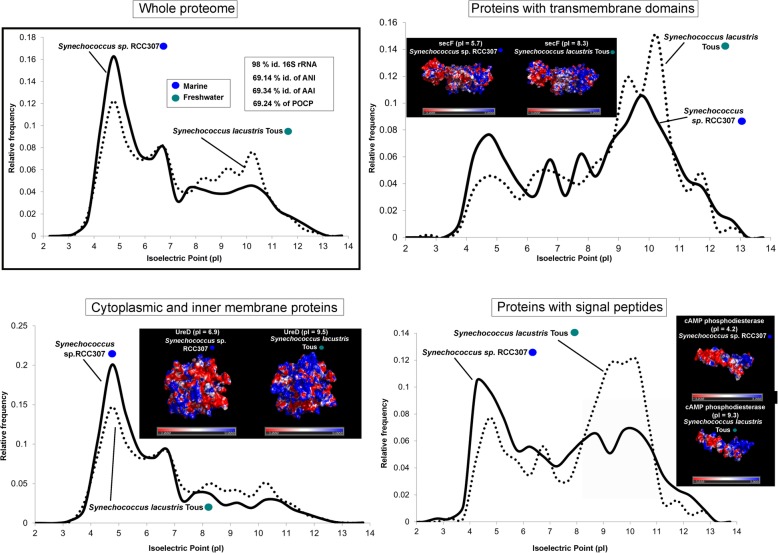
Fig. 5.
Proteome (whole and at different locations, secreted, cytoplasmic, and transmembrane) pI values versus relative frequency of Synechococcus lacustris Tous (freshwater, culture) and Synechococcus sp. RCC307 (marine, culture). Insets show tridimensional electrostatic surface potential 3D models of individual proteins selected for each location. The potentials were colored from − 3 kcal mol−1 (red) to + 3 kcal mol−1 (blue). Values of ANI, AAI, POCP, and percentage of identity of 16S rRNA for each couple of microbes are also indicated

