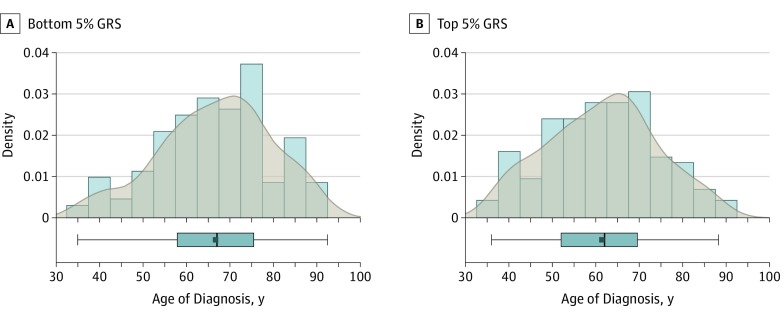
Figure. Distribution of Age at Diagnosis Among Cases in the Bottom and Top 5% of the Genetic Risk Score (GRS) .
Histogram with kernel density curves and the boxplot for the age at diagnosis in cases (mean [SD] age, 66.6 [12.9] years) in the bottom 5% GRS (9.4 risk alleles; range, 6-10.1) (A) and for the age at diagnosis in cases (mean [SD] age, 61.4 [12.7] years) in the top 5% GRS (18.3 risk alleles; range, 17.3-21) (B); P = 5.0 × 10⁻⁴.

