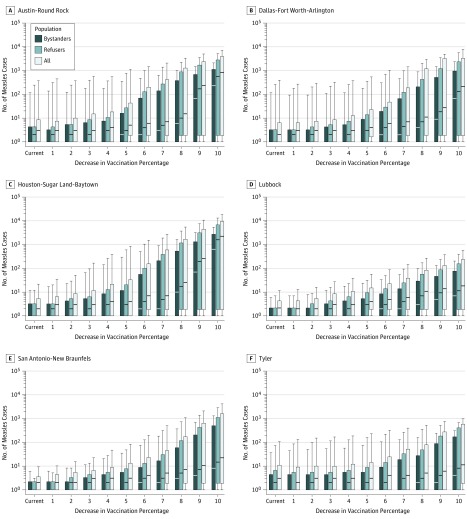
Figure 1. Forecasted Number of Cases From a Single Introduction of Measles.
Graphs show forecasted number of measles cases from a single introduction by a student for whom a vaccine has been refused, at 2018 and reduced vaccination rates. The number of cases among bystanders, refusers, and the combined population are plotted. Vaccination rates are decreased only in schools that currently have students for whom measles vaccination has been refused. Results for 6 different metropolitan statistical areas in Texas are shown. The other metropolitan statistical areas are plotted in eFigure 2 in the Supplement. Each bar shows the median (the horizontal line within each bar) and interquartile range (top and bottom of each bar); whiskers show the 5% to 95% confidence interval.

