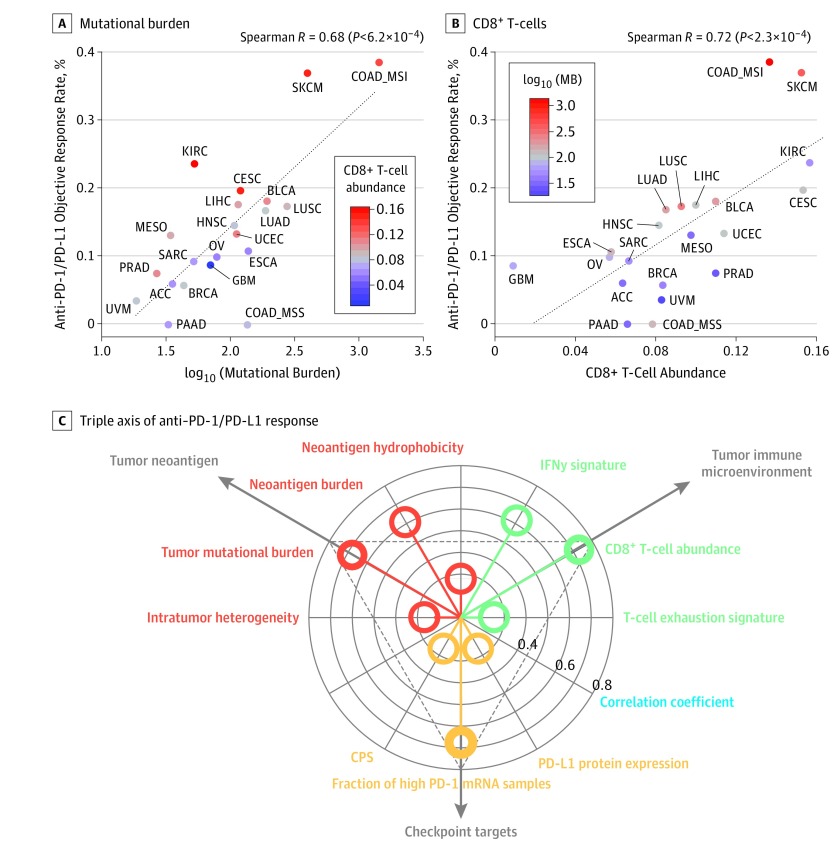
Figure 1. Systematic Evaluation of the Correlates of Therapy to Inhibit Programmed Cell Death 1 and Its Ligand (PD-1/PD-L1) Across Different Cancer Types.
A, Correlation of log10 (mutational burden) with the objective response rate to anti–PD-1/PD-L1 therapy across cancer types. The estimated CD8+ T-cell abundance (eCD8T) of each cancer type is color coded where red denotes high abundance and blue, low abundance. B, Correlation of eCD8T with the objective response rate to anti–PD-1/PD-L1 therapy across cancer types. The mutational burden of each cancer type is color coded where red denotes high mutational burden and blue, low mutational burden. C, Triple axis of anti–PD-1/PD-L1 response shows the distribution of Spearman correlation coefficients (blue) (radial axis) of the 3 classes of variables (polar axis) associated with tumor neoantigen (red), tumor immune microenvironment (green), and checkpoint targets (yellow). The dots inside the innermost circle denote the cases where the absolute value of the correlation coefficients are less than 0.30. ACC indicates adrenocortical carcinoma; BLCA, bladder carcinoma; BRCA, breast invasive carcinoma; CESC, cervical squamous cell carcinoma and endocervical adenocarcinoma; COAD MSI, microsatellite-unstable colon adenocarcinoma; COAD MSS, microsatellite-stable colon adenocarcinoma; CPS, combined positive score; ESCA, esophageal carcinoma; GBM, glioblastoma multiforme; HNSC, head and neck squamous cell carcinoma; INF, interferon; KIRC, kidney renal clear cell carcinoma; LIHC, liver hepatocellular carcinoma; LUAD, lung adenocarcinoma; LUSC, lung squamous cell carcinoma; MB, mutational burden; MESO, mesothelioma; OV, ovarian serous cystadenocarcinoma; PAAD, pancreatic adenocarcinoma; PRAD, prostate adenocarcinoma; SARC, sarcoma; SKCM, skin cutaneous melanoma; STAD, stomach adenocarcinoma; and UVM, uveal melanoma.

