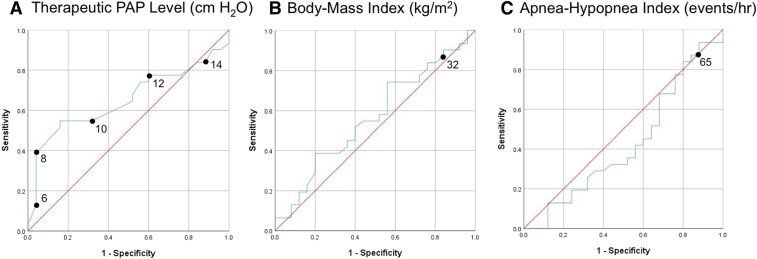
Figure 1. Predictors of HGNS response.
Blue line shows the receiver operating characteristic curve for (A) therapeutic PAP level, (B) body mass index, and (C) AHI as predictors of HGNS response. Response defined as AHI reduction > 50% and AHI < 20 events/h. Red line shows the null hypothesis. AHI = apnea-hypopnea index, HGNS = hypoglossal nerve stimulation, PAP = positive airway pressure.

