

Abstract
Proteins that get adsorbed onto the surfaces of biomaterials immediately upon their implantation mediate the interactions between the material and the environment. This process, in which proteins in a complex mixture compete for adsorption sites on the surface, is determined by the physicochemical interactions at the interface. Competitive adsorption of bovine serum albumin (BSA), fibronectin (Fn), and collagen type I (Col I), sequentially and from mixtures, was investigated so as to understand the performances of different surfaces used in biomedical applications. Quartz crystal microbalance with dissipation was used to monitor the adsorption of these proteins onto two materials used in functional bone replacement, a titanium alloy (Ti6Al4V) and Ti6Al4V physisorbed with poly(sodium styrene sulfonate) (poly(NaSS)), and three controls, gold, poly(desaminotyrosyl-tyrosine ethyl ester carbonate) (poly(DTEc)) and polystyrene (PS). In experiments with individual proteins, the adsorption was the highest with Fn and Col I and the least with BSA. And, protein adsorption was the highest on poly(NaSS) and Ti6Al4V, and the least on poly(DTEc). In sequential adsorption experiments, protein exchange was observed in BSA + Fn, Fn + Col I and BSA + Col I sequences, but not in Fn + BSA and Col I + BSA due to the lower affinity of BSA to surfaces relative to Fn and Col I. Protein adsorption was the highest with Col I + Fn on hydrophobic surfaces. In experiments with protein mixtures, with BSA & Fn, Fn appears to be preferentially adsorbed; with Fn & Col I, both proteins were adsorbed, probably as multilayers; and with Col I & BSA, the total amount of protein was the highest, greater than in sequential and individual adsorption of the two proteins, probably due to the formation of BSA and Col I complexes. Protein conformational changes induced by the adsorbing surfaces, protein-protein interactions, affinities of proteins appear to be the important factors that govern competitive adsorption. The findings reported here will be useful in understanding host response to surfaces used for implants.
Keywords: bovine serum albumin, fibronectin, collagen type I, competitive adsorption, poly(NaSS) surfaces, hydrophobic surfaces
Graphical Abstract
1. Introduction
The performance of a biomedical device is largely determined by the processes that occur when exposed to the biological fluids that consist of a complex mixtures of proteins.1 Upon implantation, proteins in the surrounding biological fluids reach to the biomaterial’s surface by diffusion. As a consequence an initial layer of protein is formed by adsorption.2 The initial composition of this layer is determined by kinetic factors such as concentration and molecular weight but also by the affinities of proteins. In turn, factors that play an important part in the thermodynamics of protein adsorption factors such as the net surface charges, hydrophobicity govern the rearrangements of the protein layer.2–4 Interestingly, the molecular weight is inversely related to adsorption kinetics by the diffusion coefficient, but increases the thermodynamic stability of adsorbed protein with relatively larger Mw. That leads to a process of exchange and transformations where in complex biological protein mixtures larger replaces smaller according to Vroman.5–7 Alternatively, it was suggested the concentration of a protein within a complex mixture remains the dominant factor determining the composition of the adsorbed layer.8 In the current view, Vroman-like exchange of proteins does occur, however it is driven by selective adsorption as the protein molecules competing for a limited number of sites available for binding to the implant surface.9
The changing properties of temporally evolving protein layers impact downstream events such as the acute cellular responses occurring directly after implantation as well as the long-term integration.2–4, 10 An understanding of the underlying processes that govern protein adsorption, interactions between proteins in a mixture and between the protein and the substrate, and the subsequent conformation changes will be helpful in predicting the cellular response to substrates in biological microenvironments. The most prominent proteins present in complex biological fluids and tissues at the implant site are albumin (Mw ≈ 66 kDa), fibronectin (Fn, Mw ≈ 250 kDa each homologous subunit) and collagen type I (Col I, Mw ≈ 360 kDa).4, 11, 12
Albumin is a small globular serum protein found in blood plasma where it contributes to the regulation of the osmotic pressure and the transport of nutrients with low water solubility such as fatty acids. In biotechnology, bovine serum albumin (BSA) is often used to block “non-specific” adhesion sites for cells or antibodies.13, 14 Fn is a large multi-domain glycoprotein, abundant in the extracellular matrix (ECM). It plays a role in cell-adhesion to biomaterials mediated by several cell recognition sites (e.g., C-terminal, N-terminal, PHSRN), and the arginine-glycine-asparagine (RGD) sequence that are all recognized by the respective cell-surface receptors.15, 16 The RGD sequence is also present in Col I, the most abundant fibrillar ECM protein. Col I has mechanical functionality, e.g., it contributes to the flexibility of the muscle, strength of the bone17–19, and interacts with other ECM proteins such as Fn.20
Previous studies tried to model the adsorption behavior in biological fluids by studying the competitive adsorption from mixtures. The adsorption of Col I on hydrophobic polystyrene (PS) substrates was reduced in the presence of BSA as demonstrated in isotopic labeling experiments using sodium [3H] borohydride.21 On hydrophilic silicon wafers, modified with hydrogen peroxide and hydrochloric acid-based solutions to increase the number of silanol groups, BSA adsorption was inhibited by Col I.22 In addition, when hydrophilic quartz crystals coated with a thin layer of hexamethyldisiloxane and treated with O2-plasma were used as a substrate, Fn displaced BSA over time, but not on hydrophobic surfaces (without O2-plasma treatment).23
In this study, we attempt to gain an insight into the competitive adsorption behavior of BSA, Col I and Fn and the changes that occur during maturation of the protein layer. As substrates, we selected examples out of the most important biomaterials classes such as titanium alloys, anionic polymer coatings as well as degradable and non-degradable polymer coatings: poly(desaminotyrosyl-tyrosine ethyl ester carbonate) (poly(DTEc)), PS and gold. Ti6Al4V is a commonly used Ti alloy as a permanent, functional substitute for bone.24 Poly(sodium styrene sulfonate) (poly(NaSS)) has been successfully grafted onto model polymer/metal surfaces demonstrating great stability in physiological environments, and promising in vitro and in vivo results.25 Furthermore, poly(NaSS) has been shown to induce selective Fn adsorption and conformation that promote cell attachment and inhibit bacterial adhesion.26, 27 Poly(DTEc) and its derivatives have been successfully applied in the fabrication of scaffolds for bone regeneration, demonstrating osteocompatibility and stimulating bone repair.28, 29 We used a quartz crystal microbalance with dissipation (QCM-D), a technique sensitive to the nano-scale measuring changes in the resonance frequencies and dissipation energy of an acoustic wave. These changes can be monitored to obtain quantitative information about the changes of mass and conformation of adsorbed protein layers.30
2. Materials and Methods
2.1. Materials
2.1.1. QCM-D Sensors
Gold-coated QCM-D sensors (fundamental frequency of 5 MHz) with and without a 50 nm thick vapor deposited Ti6Al4V (titanium alloy with aluminum and vanadium) layer were purchased from Q-Sense (Sweden). Some Ti6Al4V sensors were physisorbed for 15 h with 15% poly(NaSS) in pure water (Sigma). The rest were used as received. Gold coated sensors were divided into three groups: the first was spin coated with 1% poly(DTEc) in tetrahydrofuran (OmniSolv), the second with 1% PS in toluene (Sigma) and the last was used as uncoated gold substrates.
To prepare the sensors for QSense measurement, they were sonicated for 10 min in 99% ethanol (Sigma) and twice, 10 min each, in MilliQ® ultrapure water (Millipore), followed by drying in N2 and UV ozone sterilization for 10 min.
The thickness of the poly(NaSS) layer was determined by QCM-D and by Toluidine Blue (TB, Acros) assay. In the QCM-D experiment, the decrease in frequency (Δf) of the dry Ti6Al4V sensors after physisorption was measured at 37°C. The mass (Δm) of the deposited poly(NaSS) layer was calculated using the Sauerbrey equation: Δm = -C.Δf. This mass was converted into thickness using the density of poly(NaSS) (0.801 g/cc; source: Sigma Aldrich). For the TB assay, poly(NaSS) physisorbed crystals were immersed in an aqueous solution of TB (5×10⁻⁴ M) at 30°C for 6h. This allowed the complexation of the TB to sulfonate (SO3−) groups. The surfaces were rinsed with a 5×10⁻³ M sodium hydroxide aqueous solution to remove the non-complexed dye. The surfaces were then soaked in a mixture of acetic acid/dH2O (50/50 v/v, Sigma) for 24 h, inducing TB decomplexation. The concentrations of decomplexed TB were measured by visible spectroscopy at 633 nm using a Perkin-Elmer spectrometer lambda 25. Ti6Al4V on its own did not react with TB.
2.1.2. Protein Solutions
BSA (Sigma), human Fn (Sigma) and Col I (Sigma), were used at different concentrations, mimicking their proportion (Fn/BSA) in human plasma. BSA was used at 4000 μg/mL in phosphate buffered saline solution (PBS, Sigma), Fn at 20 μg/mL in PBS and Col I at 10 μg/mL in acetate buffer (0.1 M, pH 5.6).
2.2. Methods
2.2.1. Surface Characterization
The chemical composition of the surfaces was assessed with a X-ray photoelectron spectrometer (XPS, K-Alpha XPS Instrument, Thermo Scientific). 50 eV analyzer pass energy was used to quantify individual elements. Their concentration was determined by detailed scans of each of the elements. The X-ray spot size used was 400 μm. High resolution spectra were profile fitted (Thermo Avantage 4.51 software), and the resulting peaks areas were used to calculate the elemental compositions.
The wettability of the various surfaces was evaluated using a dynamic contact angle measuring system from Data Physics, model OCA 15 equipped with a video CCD-camera and SCA 20 software. The contact angles were measured using the sessile drop method with water (polar liquid, Millipore), diiodomethane (apolar liquid, Sigma) and glycerol (polar liquid, Acros). Prior to any measurement, sensors were allowed to dry overnight in a vacuum oven. Sensors were then positioned in a closed thermostatted chamber at 25°C saturated with the liquid sample (to avoid evaporation) and drops of 4 μL in volume were placed on the surface by a micrometric syringe, and left undisturbed for 8 sec before measurement. The surface energy was determined using the equations described in31 and the SCA 20 software. Data presented are the average of 3 measurements on 3 sensors of each kind.
Atomic force microscopy (AFM) measurements were obtained with a PicoPlus scanning probe microscope interfaced with a Picoscan 2500 controller (Keysight Technologies, USA). Each sample was imaged with a 5 × 5 μm2 piezoscanner. Imaging and roughness analyses of PS, poly(DTEc), gold and Ti6Al4V surfaces was performed in contact mode at RT. A v-shaped silicon cantilever (Keysight Technologies, USA) was used with a spring constant of 0.24 N/m and speed 0.5 l/s. The cantilever was calibrated using the thermal tune method (Thermal K). The force exerted on the surfaces was of 0.85 nN. The roughness and imaging of the poly(NaSS) physisorbed surfaces was acquired using the tapping mode because of the adhesion observed between the sample surface and the tip. Here, a bar-shaped silicon cantilever (Keysight Technologies, USA) was used with a spring constant ranging between 25–75 N/m, speed of 2.0 l/s and resonance frequency of 300 Hz. Three randomly distributed areas were analyzed per surface using the PicoView 1.20 software (Keysight Technologies, USA) and the WSx5M.32 Roughness was reported as mean roughness (Ra).
2.2.2. Single Protein Adsorption
A baseline was obtained with PBS. BSA, Fn and Col I were then individually introduced into a QCM-D module at a rate of 25 μL/min (37 °C). The flow was maintained until saturation was reached. PBS solution was used to remove unattached protein molecules after saturation. The influence of the acetate buffer used in the Col I solution was less than 5 Hz and was therefore small enough to be neglected during the analysis.
Cell cultures using MC3T3-E1 osteoblast-like cells were conducted for 2 h on BSA, Fn and Col I pre-adsorbed surfaces. The detailed procedure can be found in26.
2.2.3. Protein Competition
Experiments were designed to understand the competitive adsorption of three proteins (BSA, Fn and Col I) majorly involved in the cell response to biomaterials on different surfaces by using QCM. The aim was to differentiate the roles of (i) the surface, (ii) the protein/surface interactions and (iii) protein/protein interactions in the global protein response. For this purpose proteins were presented to the surface sequentially and from a mixture. The tests were conducted at 37°C and at a flow rate of 25 μL/min. Data from PBS was used to obtain the baseline.
2.2.3.1. Sequential Adsorption
Each of the five surfaces was exposed to a sequence of two proteins at a time for a total of six combinations: BSA + Fn, Fn + BSA, Col I + BSA, BSA + Col I, Col I + Fn and Fn + Col I. The concentration of each protein was kept the same. The adsorption of the first protein was followed until a plateau was reached. Then, a second protein solution was introduced into the module and left until a new adlayer reached saturation. Between injections, PBS was used to clean the system and remove unadsorbed proteins.
2.2.3.2. Mixture
Two proteins in a ratio of 50/50 v/v were used in three combinations (BSA & Fn, Col I & Fn and Col I & BSA) on each surface. The concentrations of the proteins were kept the same. The protein solution was kept in contact with each surface until the frequency and dissipation reached a plateau.
2.2.4. QCM-D Analysis
A QCM-D system (Q-Sense E4 instrument, Biolin Scientific, Sweden) was used to monitor the frequency (Δf) and dissipation (ΔD) shifts during protein adsorption. Voigt model was used to calculate the adsorbed protein masses by including the changes in both the frequency and dissipation, and thus taking into account the viscoelastic contributions of the hydrated layer. Data from the 3rd to the 11th harmonics were used in the analysis. The results were reported as mass per area (g/cm2). To take into account the differences in surface roughness of the different substrates, these calculated masses were normalized to the Wenzel roughness ratio. This ratio relates the real area or “ironed area”, the sum of the areas of all triangles, valleys and peaks, formed by three adjacent points, and the apparent area or geometric area, which is selected during AFM analysis33 and in this case corresponds to 25 μm2.
2.4. Statistical Analysis
All the trials were conducted in triplicate. Numerical data were reported as mean ± standard deviation (SD). Statistical significance was determined by one-way analysis of variance (ANOVA) or Kruskal-Wallis non-parametric test, depending on the distribution checked by KS normality test using the GraphPad Prism 5.0 software. Multiple comparisons were obtained after application of Tukey’s correction. Significance is defined as having p<0.05.
3. Results and Discussion
Representative and commercially important candidate materials from different classes of biomaterials were used as substrates in our protein adsorption studies by QCM-D. These were two metals (a titanium alloy and gold), an anionic polymer coating (poly(Na SS)), a degradable polymer (poly(DTEc)) and a non-degradable polymer (PS).
3.1. Surface Characterization
The protein adsorption behavior is highly dependent on the surface chemistry, wettability and topography. Therefore, we carried out XPS (surface elemental composition), contact angle (surface energy) measurements and AFM on the five substrates: vapor deposited Ti6Al4V and gold, physisorbed poly(NaSS) as well as spin-coated poly(DTEc) and PS.
The chemical composition of coatings of Ti6Al4V, poly(DTEc) and PS was consistent with those in the literature (Table 1).34–38 C, N and O were present in gold substrates, both new as well as those used and then cleaned using the manufacturer’s protocols. These are adsorbed from the surroundings. Since the protein adsorption experiments were carried out after a PBS wash, the effect of this layer is likely of little consequence. Successful physisorption of poly(NaSS) was confirmed by an increase in C, reduction in Ti, Al, and V relative to Ti6Al4V and by the presence of Na and S. However some of these changes are small, and in some instance marginal, compared to those in chemical grafting. Chemical grafting is characterized by a large increase in C, a significant reduction, but not complete absence, of Ti, Al and V, and a stoichiometric ratio of Na to S ranging between 3 and 0.3 caused both by the oxidation reaction taking place during grafting and the formation of the grafted poly(NaSS) layer.34, 35, 39 We employed the mild physisorption process to deposit poly(NaSS) onto the fragile, titanium-alloy coating obtained by physical vapor deposition (PVD) on a standard gold-coated QCM-D crystal. Chemical grafting requires harsh oxidation conditions to prime for the surface immobilization of the poly(NaSS) by radical polymerization, that are incompatible with coating QCM-D substrates. The differences in surface compositions in the two methods are due to a thinner poly(NaSS) layer obtained by physisorption than by chemical grafting. The immobilization of physisorbed poly(NaSS) onto Ti6Al4V surfaces was confirmed by TB colorimetric method and by QCM-D. The thickness of poly(NaSS) was found to be 11 nm (9.0×10⁻⁷ ± 0.13×10⁻⁷ g/cm2) by TB and 13 nm (1.1×10⁻⁶ ± 0.21×10⁻⁶ g/cm2) by QCM-D.
Table 1.
XPS elemental composition of bare Ti6Al4V, poly(NaSS) physisorbed Ti6Al4V, gold, poly(DTEc) and PS surfaces.
| XPS Atomic Percentage | ||||||||||
|---|---|---|---|---|---|---|---|---|---|---|
| Surface | Au | N | C | O | Ti | Al | V | Na | S | Impurity |
| Ti6Al4V | - | - | 3.3 ± 1.0 | 18.8 ± 2.4 | 56.9 ± 3.3 | 17.2 ± 2.0 | 3.3 ± 0.1 | - | - | 0.6 ± 0.1 |
| Poly(NaSS) | - | - | 5.3 ± 3.3 | 15.4 ± 1.3 | 49.4 ± 2.7 | 16.1 ± 2.4 | 1.7 ± 0.3 | 10.8 ± 1.9 | 0.7 ± 0.1 | 0.7 ± 0.0 |
| Au | 50.0 ± 5.8 | 9.0 ±0.4 | 28.9 ± 3.4 | 13.3 ± 4.2 | - | - | - | - | - | 4.3 ± 0.7 |
| Poly(DTEc) | - | 4.0 ± 0.1 | 75.0 ± 0.5 | 21.0 ± 0.6 | - | - | - | - | - | - |
| PS | - | - | 100.0 ± 0.0 | - | - | - | - | - | - | - |
Based on the contact angle data, the substrates were categorized by increasing hydrophobicity and decreasing hydrophilicity in the order: Ti6Al4V, poly(NaSS), gold, poly(DTEc) and PS (Table 2). The contact angles of polar liquids such as water and glycerol and the non-solvent, apolar liquid diiodomethane changed in a consistent manner for the individual substrates. For example, the contact angle of water is low for Ti6Al4V with ≈ 35° and high for PS with ≈ 94°. Conversely, the contact angle of diiodomethane is ≈ 36° for Ti6Al4V and ≈ 30° for PS. The surface energy of Ti6Al4V is ≈ 15 mN/m higher than that of PS.
Table 2.
Contact angles of water (θw), diiodomethane (θd) and gycerol (θg), and dispersive component (γd), polar component (γp) and surface energy (Δγ) of Ti6Al4V, poly(NaSS) physisorbed Ti6Al4V, gold, poly(DTEc) and PS surfaces.
| Contact Angles | Surface Energy | ||||||
|---|---|---|---|---|---|---|---|
| Surfaces | θw (°) | θd (°) | θg (°) | γd (mN/m) | γp (mN/m) | Δγ (mN/m) | |
| Ti6Al4V | 34.9 ± 9.6 | 36.2 ± 4.2 | 54.8 ± 3.7 | 24.6 | 27.7 | 52.3 ± 3.0 | |
| Poly(NaSS) | 42.1 ± 1.9 | 34.1 ± 3.3 | 58.0 ± 3.5 | 22.1 | 28.3 | 50.1 ± 2.2 | |
| Gold | 60.1 ± 4.0 | 33.3 ± 2.7 | 67.1 ± 5.7 | 34.1 | 10.5 | 44.6 ± 4.4 | |
| Poly(DTEc) | 83.6 ± 3.8 | 32.1 ± 2.0 | 76.3 ± 4.2 | 32.1 | 8.6 | 40.7 ± 2.7 | |
| PS | 94.0 ± 1.5 | 30.4 ± 0.8 | 78.3 ± 0.3 | 36.8 | 0.7 | 37.5 ± 1.4 | |
Measurement of the polar and dispersive components (γp and γd) of surface energy gives insight into the forces that are prevalent in interactions between substrates and proteins. In Ti6Al4V and poly(NaSS) γp is large thus, suggesting that protein molecules will adsorb to these surfaces via electrostatic forces. In contrast, γd is large for gold, poly(DTEc) and PS, which leads to interactions meditated by weak dispersion forces and other hydrophobic contributions.40
Introduction of sulfonate groups by chemical grafting of poly(NaSS) has been found to increase the surface hydrophilicity of titanium alloys.34 Here we find that poly(NaSS) physisorption does not change surface wettability significantly. This could be because by the some of the sulfonate groups on the polymer are involved in physisorbing the polymer to titanium, and thus fewer sulfonate groups are available to contribute to the surface hydrophilicity and for interaction with proteins.
In addition to the surface chemistry the surface wettability is influenced by the topography (Figure 1).41, 42 AFM analysis showed that Mean Roughness (Ra) increased as PS < poly(DTEc) < gold < poly(NaSS) < Ti6Al4V (Figure 2). Thus, smooth, hydrophobic surfaces are obtained by spin-coating of PS43 and poly(DTEc). In contrast, the vapor deposition of metal-alloys produced rougher surfaces. For Ti6Al4V surfaces, we find a water contact angle of θw = 35° as compared to conflicting values reported in the literature with θw = 88° and 62°.44, 45 These surface energies are important in explaining the QCM-D data discussed in later sections. The mass of the adsorbed proteins in the polar Ti6Al4V and poly(NaSS) calculated using the Voigt model were at least 2x larger than that with the Sauerbrey model, they were about the same in poly(DTEc) and PS, and the two masses were between these two extremes in gold. Voigt model takes into account the viscoelastic properties of the adsorbed layer, while the Sauerbrey equation assumes that the adsorbed layer is rigid. The differences in the results from these two models show that the nature of the protein adlayer depends dramatically on the polarity of the substrate; the layer is rigid on hydrophobic substrates, and compliant on polar substrates.
Figure 1.

Topography (5 × 5 μm2) of Ti6Al4V, poly(NaSS), gold, poly(DTEc) and PS surfaces obtained by AFM.
Figure 2.

Mean roughness (Ra) of Ti6Al4V, poly(NaSS), gold, poly(DTEc) and PS surfaces determined by AFM. The Wenzel ratios for these five substrates are 1.01557, 1.00727, 1.00156, 1.00046, and 1.00039, respectively.
3.2. Adsorption of Individual Proteins
We studied the adsorption behavior of BSA, Fn and Col I considering the critical variables such as concentration, Mw and diffusion coefficients (Figure 3). Five examples of important biomaterials classes were selected as adsorption substrates based on surface properties, such as chemical composition and wettability.46–48 Examples of the frequency and dissipation curves are shown in Figure 4 for gold. Similar results were obtained on other substrates. When expressed in terms of protein mass and not in moles of protein, the results show BSA to be the least adsorbed protein, while Col I and Fn are the most adsorbed.
Figure 3.

Single protein adsorption of BSA, Fn and Col I onto Ti6Al4V, poly(NaSS), gold, poly(DTEc) and PS, after saturation (37°C and 25 μL/min). Significant differences between surfaces pre-adsorbed with the same protein are indicated by * (* p<0.05, ** p<0.001 and *** p<0.0001).
Figure 4.

Representation of frequency (Δf) and dissipation (ΔD) changes (9th harmonic) with time during single protein adsorption onto gold sensors (example), at 37°C and 25 μL/min.
That BSA had the smallest observed adsorbed surface mass on all the substrates can be explained by considering the molar mass of BSA (66 kDa) and its affinity for surfaces as well as all structural contributions to the quantities of adsorbed protein. The smaller size of BSA molecule, results in faster diffusion and saturation but seems not to determine the mass of the adsorbed layer. BSA, with a tightly packed globular shape, undergoes only little structural reorganization following adsorption such as switching from “side-on” or “end-on” conformation; thus only little additional molecules are able to be introduced into the surface layer.48, 49 In contrast, Fn not only has a higher Mw (250 kDa), but can assemble with its long-axis perpendicular to the surface, resulting in a higher mass per unit area.16 Fn polymerization/complex formation has also been reported.50 Col I, on the other hand, is likely to form multiple layers and may undergo reorganization into fibrils at the surface.51 If we take into account the affinities of those proteins to the surface, these adsorption results are consistent with previously observed ones on similar surfaces: BSA has a lower affinity to surfaces (Ka 10−5 L/mol) when compared to Fn (Ka 10−6).
The adsorption kinetics for BSA, Fn and Col I were followed to the endpoint (Figure 4). BSA saturated after 30 min according due to its high concentration (4000 μg/mL) and diffusion coefficient.17, 20 By comparison, Fn achieved the steady state after a much longer interval of 4 h, and Col I reached the plateau only after 12 h. This observation can be explained in part by the low concentrations of Fn and Col I with 20 μg/mL and 10 μg/mL, respectively. In addition, structural changes that occur subsequent to the initial adsorption contribute to slower saturation as limited new binding sides are accessible over time. Thus, the endpoint of protein adsorption is determined by the rate of protein refolding and rotation at the surface rather than the rate of adsorption.46 This finding has implications for biomaterials coatings as crowded protein interfaces from concentrated solutions may result in unfavorable conformations for cell adhesion.49 At low concentrations, proteins are able to spread and reach a conformation that minimizes the energy after adsorption.48, 49
From the perspective of the substrates, the highest surface mass of adsorbed proteins was observed for Ti6Al4V with and without physisorbed poly(NaSS) (Figure 3). These values have been corrected to take into account the differences in the surface roughness. Interestingly, when poly(NaSS) was present on Ti6Al4V, 37% more collagen was adsorbed; BSA adsorption was slightly higher, and Fn adsorption was statistically not much different. Although poly(NaSS) is slightly smoother than Ti6Al4V, the amount of protein adsorbed onto poly(NaSS) is higher even after normalized to the differences in the surface area. This finding constitutes a remarkable example of how the introduction of charged functional groups can selectively increase adsorption for a specific protein such as Col I.52 For poly(NaSS) the increased binding is mediated by sulfonate groups which (1) are negatively charged, (2) induce swelling in buffer solution leading to higher available surfaces area (binding sites) for protein adsorption when immersed in physiological fluids,53 and (3) increase the protein affinity (Fn).
The protein adsorption decreased on more hydrophobic surfaces such as gold and even more so for poly(DTEc) and PS. The mean roughness of poly(DTEc) and PS are about the same (Figure 2). However, poly(DTEc) surfaces showed higher cell adhesion than PS, despite its hydrophobicity and low protein adsorption profile (Figures 3 and 5). Thus, the amount of protein adsorbed onto the surface is not always a predictor of cell adhesivity.5, 6 This could be because the protein molecules that actually reach the surface undergo significant conformational rearrangements during adsorption that result in increased exposure of cell binding sites (e.g. RGD).27 It is possible that the amide functionality present in the DTE repeating unit in this polymer provides hydrogen-bonding sites for cell adhesion proteins, thus stabilizing their native state.28 The best cell attachment profile was obtained from physisorbed poly(NaSS) this is consistent with previous results observed on sulfonated surfaces. It is likely that the electrostatic interactions that in part govern the protein adsorption on these surfaces alter the protein conformation in such a way as to improve the interaction with cell integrins involved cell adhesion. In this case protein adsorption may correlate with the cell-adhesion.27, 45
Figure 5.

Correlation between the amounts of BSA, Fn and Col I adsorbed onto the five surfaces and the MC3T3-E1 cell attachment in the presence of the same proteins (the actual amount of cells attached to each surface can be found in27).
3.3. Competitive adsorption of proteins
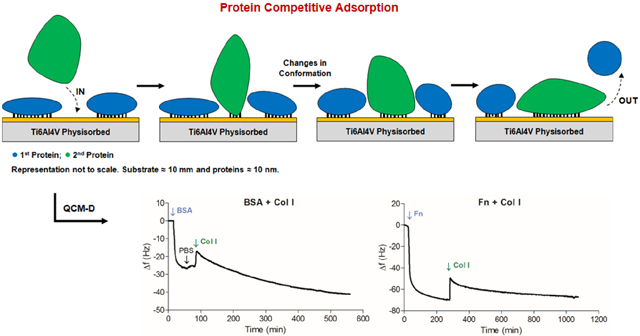
To mimic the adsorption behavior of proteins from complex biological fluids, we applied combinations of the set BSA, Fn and Col I in sequence in which one protein is first adsorbed followed by a second ( indicated by “+”), and from binary mixtures two proteins are present in solution at the same time (indicated by “&”). The mass change deduced from QCM-D relates to the change in the hydrated mass of the adsorbed protein. Furthermore, the dissipation change that is evaluated from the QCM-D data could be due to changes in the conformation of the adsorbed protein, to changes in the water content, or a combination of the two. QCM-D by itself does not different possibilities to be distinguished, and also lacks the specificity to identify the protein that is adsorbed. This imposes a limitation in interpreting the results from the adsorption of multiple proteins. Nevertheless, we were able to make reasoned conclusions about the nature of the final adsorbed protein layer by making use of the corroborative results on these same proteins found in the literature, and by following the changes in both mass and dissipation.
3.3.1. Sequential Adsorption
Substrates were exposed to six pairs of proteins. The adsorbed mass of the second protein is shown in Figure 6 (left panel). Right panel shows the changes in frequency and dissipation on gold. All the features, including the sharp change in ΔD with collagen were observed on all the other substrates as well. The protein masses given in the figure are relative to that observed in single protein experiments. We observed that in all instances with the exception of Col I + Fn, the adsorption of the first protein reduced the adsorption of the second protein. This effect was more pronounced when the first protein was larger or had a more complex architecture than the second (Fn + BSA or Col I + BSA in Figures 6A and 6B, respectively).
Figure 6.

Left panel: Adsorption of the second protein onto Ti6Al4V, poly(NaSS), gold, poly(DTEc) and PS after the adsorption of the first protein, until saturation. The protein percentages shown in the left panel is the ratio (as %) of the amount of the second protein adsorbed, after a first protein, to the amount adsorbed when the second protein is present by itself on the same surface (100%). Right panel: Representation of frequency (Δf) and dissipation (ΔD) changes (9th harmonic) with time during sequential adsorption of proteins onto gold sensors. (A) BSA + Fn and Fn + BSA; (B) BSA + Col I and Col I + BSA; (C) Fn + Col I and Col I + Fn, at 37°C and 25 μL/min.
In the case of BSA + Fn the amount of the two proteins adsorbed together after almost 4 h was similar to that of Fn by itself (Table 3), e.g. on poly(NaSS), the adsorbed mass is ≈ 2101 ng/cm2 with BSA+ Fn and ≈ 2113 ng/cm2 with Fn. The histogram in Figure 6A, shows that the amount of Fn adsorbed after the adsorption of BSA is 50–70% of that found with Fn by itself. This assumes that Fn is deposited on top of BSA, but in fact a continuous displacement of BSA by Fn occurs with time (Vroman effect), and eventually there is only Fn on the surface. By studying the adsorption of BSA, IgG and fibrinogen (Fg) from mixtures onto PS coated QCM-D sensors, Green et al. determined that BSA is displaced by other proteins: IgG displaced BSA very quickly, while Fg was capable of desorbing both BSA and IgG.54 Fn exhibits the same pattern of desorption.55 By using antibody detection they demonstrated BSA was no longer present by the time Fg saturated the surface. Additionally, in the dissipation curves in Figures 4 and 6A, we see that ΔD in BSA + Fn is twice that with Fn by itself. Large ΔD is associated with increased flexibility of the adsorbed proteins.56 It is possible that the electrostatic interactions of BSA with the negatively charged sulfonate groups of poly(NaSS) are weak enough that when Fn arrives at the surface, it displaces BSA as postulated in the Vroman effect. These considerations lead us to conclude that the adsorbed mass with BSA+Fn is entirely due to Fn, thus demonstrating the Vroman effect.
Table 3.
Total protein mass adsorbed from single (Figure 1), sequences (Figure 6) and mixtures (Figure 7) onto Ti6Al4V, poly(NaSS), gold, poly(DTEc) and PS.
| Mass (ng/cm2) | ||||||
|---|---|---|---|---|---|---|
| Ti6Al4V | Poly(NaSS) | Gold | Poly(DTEc) | PS | ||
| Single | BSA | 1091 ± 80 | 1335 ± 153 | 872 ± 100 | 408 ± 87 | 701 ± 39 |
| Fn | 2189 ± 55 | 2098 ± 247 | 1515 ± 230 | 858 ± 41 | 1076 ± 273 | |
| Col I | 1734 ± 324 | 2750 ± 251 | 1439 ± 254 | 699 ± 123 | 981 ± 144 | |
| Sequences | BSA + Fn | 2063 ± 42 | 2086 ± 92 | 1287 ± 64 | 702 ± 75 | 873 ± 95 |
| Fn + BSA | 2211 ± 159 | 2352 ± 115 | 1611 ± 62 | 993 ± 84 | 1184 ± 171 | |
| BSA + Col I | 1325 ± 107 | 2513 ± 196 | 958 ± 114 | 618 ± 30 | 1000 ± 22 | |
| Col I + BSA | 1865 ± 83 | 3123 ± 121 | 1517 ± 92 | 752 ± 126 | 1072 ± 148 | |
| Fn + Col I | 1802 ± 135 | 2081 ± 116 | 927 ± 133 | 744 ± 50 | 867 ± 72 | |
| Col I + Fn | 3850 ± 97 | 5021 ± 110 | 2402 ± 128 | 2575 ± 218 | 3973 ± 192 | |
| Mixtures | BSA & Fn | 2091 ± 66 | 2221 ± 101 | 1434 ± 31 | 911 ± 44 | 1025 ± 85 |
| Fn & Col I | 3825 ± 156 | 5352 ± 404 | 3004 ± 524 | 4372 ± 197 | 4562 ± 586 | |
| Col I & BSA | 7029 ± 571 | 8761 ± 362 | 5782 ± 157 | 10726 ± 963 | 4459 ± 556 | |
Vroman effect5, 6 was also observed in the sequences BSA + Col I (Figure 6B) and Fn + Col I (Figure 6C). In these sequences, the large changes in dissipation after the introduction of Col I show a large increase in the flexibility of the protein layer. This suggests that the proteins are more loosely bound to the surfaces, and are capable of being displace or undergo conformational rearrangements.
In Fn + BSA and Col I + BSA sequences, the first protein to be adsorbed prevented the adsorption of BSA, obviously because the first protein is larger and has a greater affinity to the surface than BSA.
The adsorption of proteins from Col I + Fn (Figure 6C) was dependent on the nature of the surface, hydrophobicity or hydrophilicity, and the charge. Col I reduced the adsorption of Fn on Ti6Al4V and gold, and increased it on poly(NaSS), poly(DTEc) and PS. The behavior observed on Ti6Al4V and gold is expected as both surfaces are not charged and are hydrophilic. Therefore, the secondary structure (triple-helix) of Col I that contains the binding domains remains folded, thus decreasing the accessibility to the Fn-binding regions. In contrast, poly(DTEc) and PS are hydrophobic, and poly(NaSS) is negatively charged. It is possible that hydrophobic and electrostatic interactions, allow the secondary structure of Col I to unfold. The resulting conformation will expose more Fn-binding sites.48, 49 Interactions between Col I and Fn in physiological solutions enable the Fn molecule to acquire a more stable conformation by increasing the number of active binding sites.57 It is however important to recall that once adsorbed on hydrophobic surfaces such as poly(DTEc) and PS, the proteins are unlikely to desorb to make room for other proteins to bind. As a result, multilayer protein associations often occur.48, 49 Fluorescent studies of Williams et al. showed that Col I binds to Fn through a collagen binding site near the middle of the Fn protein chain, generating a tight bond that decreases the protein diffusion coefficient but increases the flexibility of the N-terminus of the Fn molecule (unfolding). This allows for other binding sites to be exposed, including more regions for Col I binding and even possible sites for self-assembling, all contributing to Fn adsorption.58
3.3.2. Adsorption from Binary Protein Mixtures
The competition between proteins for the adsorption sites on the surfaces was studied from binary mixtures of BSA, Fn and Col I. Figure 7 (left panel) shows the mass of protein adsorbed on each substrate and an example of the changes in frequency and dissipation with time. Examples of the frequency and dissipation curves are shown in the right panel for gold. Similar results were obtained on other substrates.
Figure 7.

Left panel: Mass density changes on Ti6Al4V, poly(NaSS), gold, poly(DTEc) and PS as a result of the adsorption of binary mixtures (two proteins in solution). Significant differences between surfaces are indicated by * (* p<0.05, ** p<0.001 and *** p<0.0001). Right panel: Representation of frequency (Δf) and dissipation (ΔD) changes (9th harmonic) with time during adsorption of mixtures of proteins onto gold sensors (A) BSA & Fn; (B) Fn & Col I; (C) Col I & BSA, at 37°C and 25 μL/min.
In the first moments of interaction, the sorbent surface is mainly populated by smaller and more abundant molecules because of their faster rate of diffusion. At later stages, the adsorbed molecules may be displaced by others with stronger affinity and tendency to be adsorbed (usually less motile). This way, in the course of the adsorption process, the protein population at the surface and by extension the solution will change, resulting in a protein layer whose composition is often completely different from the initial composition.46 This process is observed with BSA & Fn mixture (Figure 7A), as indicated by a continuous increase in dissipation, indicative of the flexibility of the layer; in the absence of protein exchanges, dissipation would be constant.56 As in the case of sequential adsorption, the protein mass resulting from the mixture is similar to that of adsorption of Fn alone (Table 3). Together with the results from section 3.3.1, we can conclude that BSA, despite being adsorbed first onto the surface, is progressively displaced by Fn until saturation is reached.
In the Fn & Col I mixture, complete protein adsorption was attained 12 h after insertion (Figure 7B). A sharp decrease in frequency caused by the initial adsorption of proteins was followed by a small but continuous increase in frequency. The corresponding small decrease in mass from 3 h to 12 h is not accompanied by an expected decrease in dissipation. Instead, ΔD continues to increase, indicating that the protein layer is soft and flexible. This assertion is consistent with the finding that Voigt mass was 5 to 20x the Sauerbrey mass only in this set of measurements. It could be that extensive protein-protein interactions are occurring resulting in complex formations or protein displacement, as seen earlier in the sequential insertion of proteins (section 3.3.1). When Col I binds to Fn through a collagen binding site near the middle of the Fn protein chain as a consequence of such interactions, Fn unfolds exposing additional binding sites, thus allowing for more protein-protein interactions. As a result of the ensuing self-assembly, a multilayer of proteins is likely to be formed.58 Interestingly, the total protein mass adsorbed onto Ti6Al4V (≈ 3885 ng/cm2), poly(NaSS) (≈ 5391 ng/cm2) and gold (≈ 3009 ng/cm2) is close to that of the sum of the individual masses of Col I and Fn (Figure 3 or Table 3). On hydrophobic surfaces, poly(DTEc) and PS, the adsorbed protein mass is higher than the sum of masses the two proteins adsorbed individually (≈ 4374 and ≈ 4564 ng/cm2, respectively). We notice a similar behavior in the sequential adsorption of Col I + Fn (Figure 6C). The hydrophobic surfaces induce the adsorbed proteins to unfold, and cause them to expose their normally buried hydrophobic residues and thus increase the exposure of other protein binding sites.46 We recently demonstrated that despite these favorable interactions with hydrophobic surfaces, hydrophilic surfaces such as Ti6Al4V and poly(NaSS) are more advantageous for osteoblastic cell attachment using Fn & Col I mixtures at the interface,34 as the unfolding of the protein at the hydrophobic surface may lead to protein denaturation or loss of activity.59
The observations with the Col I & BSA mixture were quite different (Figure 7C and Table 3): on all the surfaces, not only is the behavior different form the two other mixtures, but the amount of protein adsorbed was higher than the sequential combinations or the sum of the individual values. The change in ΔD was also greater, indicating more viscous behavior of the adsorbed proteins. This could be caused by the formation of BSA-Col I complexes at before being adsorbed onto the substrate. At the pHs used in these experiments (7.4, physiological), Col I interacts more easily with other proteins in solution.60 BSA contains numerous binding sites for hydrophobic molecules that are also present in the Col I molecule.61 Since the concentration of BSA is the highest of the three proteins used in study, numerous interactions can occur. Because of small size and globular shape of BSA and the fibrous structure of Col I, BSA molecules interact with the sites that are less accessible to a larger structured protein. All these factors contribute significantly to the increased adsorption of the Col I & BSA mixture.
Conclusions
The study of the adsorption of BSA, Fn and Col I onto Ti6Al4V, poly(NaSS), gold, poly(DTEc) and PS showed that the competitive adsorption is determined by the type of proteins present in the solution and the nature (hydrophilic/hydrophobic/charged) of the surface. Conformational changes of the proteins that occur upon adsorption plays a large role in this process.
We find that the adsorption of larger proteins that undergo conformational change (Fn and Col I) is higher than that of small-tightly packed proteins (BSA). The proteins we have studied have a greater affinity to hydrophilic surfaces. Poly(NaSS) and Ti6Al4V were the most adsorptive surfaces. Poly(DTEc) was the least adsorptive surface, although cell attachment was the highest.
Vroman effect was seen in sequential adsorptions of BSA + Fn, Fn + Col I and BSA + Col I. With Fn + BSA and Col I + BSA, the first protein to adsorb prevented the adsorption of the second protein. In the Col I + Fn sequence, the adsorption of Fn was greater than its individual values. This is attributed to the electrostatic interactions between proteins. The most hydrophobic surfaces adsorbed the most protein likely by causing the secondary structure of Col I to unfold and thus increasing exposing the binding sites.
Proteins with a higher affinity to the surfaces are preferentially adsorbed even when present in a mixture with smaller proteins with weaker affinity; adsorption from BSA & Fn mixtures was similar to that of Fn by itself. With molecules of similar affinity to the surface, the adsorbed mass is twice the individual masses, suggesting formation of layered structure; this was observed in Fn & Col I mixtures. The Col I & BSA mixture was unique in that it showed the highest protein adsorption among the three mixtures. This could be due to the formation of BSA and Col I complexes favored at the higher BSA concentration and basic pH.
Acknowledgements
HF would like to thank the Romano family for funding her internship at the New Jersey Center for Biomaterials (NJCBM), as a part of the NJCBM International Exchange Program, and the École Doctorale Galilée and the Agence Nationale de la Recherche (ANR, Program TECSAN, Project ACTISURF, ANR-09-TECS-001–01) for the financial support during this work. H.F. was supported by the Ministère de la Recherche (France). This work at the NJCBM was supported in part by RESBIO – The National Resource for Polymeric Biomaterials funded by the National Institute of Health (NIH grant EB001046). The content is solely the responsibility of the authors and does not necessarily represent the official views of the NIH, NIBIB or NCMHD.
References
- 1.Pandey LM; Pattanayek SK, Properties of Competitively Adsorbed BSA and Fibrinogen from their Mixture on Mixed and Hybrid Surfaces. Appl. Surf. Sci 2013, 264, 832–837. [Google Scholar]
- 2.Puleo D; Nanci A, Understanding and Controlling the Bone–Implant Interface. Biomaterials 1999, 20 (23), 2311–2321. [DOI] [PubMed] [Google Scholar]
- 3.Wilson CJ; Clegg RE; Leavesley DI; Pearcy MJ, Mediation of Biomaterial-Cell Interactions by Adsorbed Proteins: a Review. Tissue Eng. 2005, 11 (1–2), 1–18. [DOI] [PubMed] [Google Scholar]
- 4.Deyme M; Baszkin A; Proust JE; Perez E; Albrecht G; Boissonnade MM, Collagen at Interfaces 11: Competitive Adsorption of Collagen Against Albumin and Fibrinogen. J. Biomed. Mater. Res 1987, 21, 321–328. [DOI] [PubMed] [Google Scholar]
- 5.Hirsh SL; McKenzie DR; Nosworthy NJ; Denman JA; Sezerman OU; Bilek MM, The Vroman Effect: Competitive Protein Exchange with Dynamic Multilayer Protein Aggregates. Colloids Surf. B Biointerfaces 2013, 103, 395–404. [DOI] [PubMed] [Google Scholar]
- 6.Jung S-Y; Lim S-M; Albertorio F; Kim G; Gurau MC; Yang RD; Holden MA; Cremer PS, The Vroman Effect: a Molecular Level Description of Fibrinogen Displacement. J. Am. Chem. Soc 2003, 125 (42), 12782–12786. [DOI] [PubMed] [Google Scholar]
- 7.Vroman L; Adams AL, Identification of Rapid Changes at Plasma–Solid Interfaces. J. Biomed. Mater. Res 1969, 3 (1), 43–67. [DOI] [PubMed] [Google Scholar]
- 8.Brash J; Lyman D, Adsorption of Plasma Proteins in Solution to Uncharged, Hydrophobic Polymer Surfaces. J. Biomed. Mater. Res 1969, 3 (1), 175–189. [DOI] [PubMed] [Google Scholar]
- 9.Noh H; Vogler EA, Volumetric Interpretation of Protein Adsorption: Competition from Mixtures and the Vroman Effect. Biomaterials 2007, 28 (3), 405–422. [DOI] [PMC free article] [PubMed] [Google Scholar]
- 10.Servoli E; Maniglio D; Aguilar MR; Motta A; Roman JS; Belfiore LA; Migliaresi C, Quantitative Analysis of Protein Adsorption via Atomic Force Microscopy and Surface Plasmon Resonance. Macromol. Biosci 2008, 8 (12), 1126–1134. [DOI] [PubMed] [Google Scholar]
- 11.Tagaya M; Ikoma T; Takemura T; Hanagata N; Yoshioka T; Tanaka J, Effect of Interfacial Proteins on Osteoblast-like Cell Adhesion to Hydroxyapatite Nanocrystals. Langmuir 2011, 27 (12), 7645–7653. [DOI] [PubMed] [Google Scholar]
- 12.Huang Y; Lü X; Qian W; Tang Z; Zhong Y, Competitive Protein Adsorption on Biomaterial Surface Studied with Reflectometric Interference Spectroscopy. Acta Biomater. 2010, 6 (6), 2083–2090. [DOI] [PubMed] [Google Scholar]
- 13.Carter DC; He X-M; Munson SH; Twigg PD; Gernert KM; Broom MB; Miller TY, Three-Dimensional Structure of Human Serum Albumin. Science 1989, 244 (4909), 1195–1198. [DOI] [PubMed] [Google Scholar]
- 14.Dockal M; Carter DC; Rüker F, The Three Recombinant Domains of Human Serum Albumin Structural Characterization and Ligand Binding Properties. J. Biol. Chem 1999, 274 (41), 29303–29310. [DOI] [PubMed] [Google Scholar]
- 15.Pankov R; Yamada KM, Fibronectin at a Glance. J. Cell Sci 2002, 115 (20), 3861–3863. [DOI] [PubMed] [Google Scholar]
- 16.Mosher DF; Furcht LT, Fibronectin: Review of its Structure and Possible Functions. J. Invest. Derm 1981, 77 (2), 175–180. [DOI] [PubMed] [Google Scholar]
- 17.Pareti FI; Fujimura Y; Dent JA; Holland LZ; Zimmerman TS; Ruggeri Z, Isolation and Characterization of a Collagen Binding Domain in Human von Willebrand Factor. J. Biol. Chem 1986, 261 (32), 15310–15315. [PubMed] [Google Scholar]
- 18.Buehler MJ, Nature Designs tough Collagen: Explaining the Nanostructure of Collagen Fibrils. Proc. Natl. Acad. Sci 2006, 103 (33), 12285–12290. [DOI] [PMC free article] [PubMed] [Google Scholar]
- 19.Gelse K; Pöschl E; Aigner T, Collagens—Structure, Function, and Biosynthesis. Adv. Drug Deliv. Rev 2003, 55 (12), 1531–1546. [DOI] [PubMed] [Google Scholar]
- 20.Erat MC; Sladek B; Campbell ID; Vakonakis I, Structural Analysis of Collagen Type I Interactions with Human Fibronectin Reveals a Cooperative Binding Mode. J. Biol. Chem 2013, 288 (24), 17441–17450. [DOI] [PMC free article] [PubMed] [Google Scholar]
- 21.Dewez J-L; Berger V; Schneider Y-J; Rouxhet PG, Influence of Substrate Hydrophobicity on the Adsorption of Collagen in the Presence of Pluronic F68, Albumin, or Calf Serum. J. Colloid Interface Sci. 1997, 191 (1), 1–10. [DOI] [PubMed] [Google Scholar]
- 22.Ying P; Yu Y; Jin G; Tao Z, Competitive Protein Adsorption Studied with Atomic Force Microscopy and Imaging Ellipsometry. Colloids Surf. B Biointerfaces 2003, 32 (1), 1–10. [Google Scholar]
- 23.Wei J; Igarashi T; Okumori N; Igarashi T; Maetani T; Liu B; Yoshinari M, Influence of Surface Wettability on Competitive Protein Adsorption and Initial Attachment of Osteoblasts. Biomed. Mater 2009, 4 (4), 045002. [DOI] [PubMed] [Google Scholar]
- 24.Long M; Rack HJ, Titanium Alloys in Total Joint Replacement—a Materials Science Perspective. Biomaterials 1998, 19 (18), 1621–1639. [DOI] [PubMed] [Google Scholar]
- 25.Viateau V; Zhou J; Guérard S; Manassero M; Thourot M; Anagnostou F; Mitton D; Brulez B; Migonney V, Ligart: Synthetic” Bioactive” and” Biointegrable” Ligament Allowing a Rapid Recovery of Patients: Chemical Grafting, in vitro and in vivo Biological Evaluation, Animal Experiments, Preclinical Study. IRBM 2011, 32 (2), 118–122. [Google Scholar]
- 26.Felgueiras HP; Sommerfeld SD; Murthy NS; Kohn J; Migonney V. r., Poly (NaSS) Functionalization Modulates the Conformation of Fibronectin and Collagen Type I to Enhance Osteoblastic Cell Attachment onto Ti6Al4V. Langmuir 2014, 30 (31), 9477–9483. [DOI] [PMC free article] [PubMed] [Google Scholar]
- 27.Latz C; Pavon-Djavid G; Hélary G; Evans MD; Migonney V, Alternative Intracellular Signaling Mechanism Involved in the Inhibitory Biological Response of Functionalized PMMA-based Polymers. Biomacromolecules 2003, 4 (3), 766–771. [DOI] [PubMed] [Google Scholar]
- 28.James K; Levene H; Parsons JR; Kohn J, Small Changes in Polymer Chemistry have a Large Effect on the Bone–Implant Interface: Evaluation of a Series of Degradable Tyrosine-Derived Polycarbonates in Bone Defects. Biomaterials 1999, 20 (23), 2203–2212. [DOI] [PubMed] [Google Scholar]
- 29.Choueka J; Charvet JL; Koval KJ; Alexander H; James KS; Hooper KA; Kohn J, Canine Bone Response to Tyrosine-Derived Polycarbonates and Poly (L-lactic acid). J. Biomed. Mater. Res 1996, 31 (1), 35–41. [DOI] [PubMed] [Google Scholar]
- 30.Zhou T; Marx KA; Warren M; Schulze H; Braunhut SJ, The Quartz Crystal Microbalance as a Continuous Monitoring Tool for the Study of Endothelial Cell Surface Attachment and Growth. Biotechnol. Prog 2000, 16 (2), 268–277. [DOI] [PubMed] [Google Scholar]
- 31.Van Oss C; Ju L; Chaudhury M; Good R, Estimation of the Polar Parameters of the Surface Tension of Liquids by Contact Angle Measurements on Gels. J. Colloid Interface Sci 1989, 128 (2), 313–319. [Google Scholar]
- 32.Horcas I; Fernández R; Gomez-Rodriguez J; Colchero J; Gómez-Herrero J; Baro A, WSXM: a Software for Scanning Probe Microscopy and a Tool for Nanotechnology. Rev. Sci. Instrum 2007, 78 (1), 013705. [DOI] [PubMed] [Google Scholar]
- 33.Fink R; Oder M; Rangus D; Raspor P; Bohinc K, Microbial Adhesion Capacity. Influence of Shear and Temperature Stress. Int. J. Environ. Health Res 2015, 25 (6), 656–669. [DOI] [PubMed] [Google Scholar]
- 34.Felgueiras HP; Aissa IB; Evans MDM; Migonney V, Contributions of Adhesive Proteins to the Cellular and Bacterial Response to Surfaces Treated with Bioactive Polymers: case of Poly(sodium styrene sulfonate) Grafted Titanium Surfaces. J. Mater. Sci. Mater. Med 2015, 26 (11), 1–14. [DOI] [PubMed] [Google Scholar]
- 35.Felgueiras H; Migonney V, Sulfonate Groups Grafted on Ti6Al4V Favor MC3T3-E1 Cell Performance in Serum Free Medium Conditions. Mater. Sci. Eng. C 2014, 39, 196–202. [DOI] [PubMed] [Google Scholar]
- 36.Cavalleri O; Natale C; Stroppolo M; Relini A; Cosulich E; Thea S; Novi M; Gliozzi A, Azurin Immobilisation on Thiol Covered Au (111). Phys. Chem. Chem. Phys 2000, 2 (20), 4630–4635. [Google Scholar]
- 37.Perez-Luna VH; Kohn J; Graham DJ; Ratner BD, Poly (Desaminotyrosyl-tyrosine Carbonate Ethyl Ester) Studied by XPS. Surf. Sci. Spectra 2002, 9 (1), 6–11. [Google Scholar]
- 38.Browne M; Lubarsky G; Davidson M; Bradley R, Protein Adsorption onto Polystyrene Surfaces Studied by XPS and AFM. Surf. Sci 2004, 553 (1), 155–167. [Google Scholar]
- 39.Michiardi A; Hélary G; Nguyen P-C; Gamble LJ; Anagnostou F; Castner DG; Migonney V, Bioactive Polymer Grafting onto Titanium Alloy Surfaces. Acta Biomater. 2010, 6 (2), 667–675. [DOI] [PMC free article] [PubMed] [Google Scholar]
- 40.Van Oss CJ; Chaudhury MK; Good RJ, Interfacial Lifshitz-van der Waals and Polar Interactions in Macroscopic Systems. Chem. Rev 1988, 88 (6), 927–941. [Google Scholar]
- 41.Ponsonnet L; Reybier K; Jaffrezic N; Comte V; Lagneau C; Lissac M; Martelet C, Relationship Between Surface Properties (Roughness, Wettability) of Titanium and Titanium Alloys and Cell Behaviour. Mater. Sci. Eng. C 2003, 23 (4), 551–560. [Google Scholar]
- 42.Murthy NS In Surface Modification of Biomaterials Methods, Analysis and Applications; Williams R; Woodhead Publishing, Cambridge, UK, 2010; Chapter 3 (Part III), pp. 232–254. [Google Scholar]
- 43.Petri D, Characterization of Spin-Coated Polymer Films. J. Braz. Chem. Soc 2002, 13 (5), 695–699. [Google Scholar]
- 44.Gallardo-Moreno AM; Pacha-Olivenza MA; Saldaña L; Pérez-Giraldo C; Bruque JM; Vilaboa N; González-Martín ML, In vitro Biocompatibility and Bacterial Adhesion of Physico-Chemically Modified Ti6Al4V Surface by means of UV Irradiation. Acta Biomater 2009, 5 (1), 181–192. [DOI] [PubMed] [Google Scholar]
- 45.Felgueiras HP; Evans MD; Migonney V, Contribution of Fibronectin and Vitronectin to the Adhesion and Morphology of MC3T3-E1 Osteoblastic Cells to Poly (NaSS) Grafted Ti6Al4V. Acta Biomater 2015, 28, 225–233. [DOI] [PubMed] [Google Scholar]
- 46.Norde W, Adsorption of Proteins from Solution at the Solid-Liquid Interface. Adv. Colloid Interface Sci 1986, 25, 267–340. [DOI] [PubMed] [Google Scholar]
- 47.Rabe M; Verdes D; Seeger S, Understanding Protein Adsorption Phenomena at Solid Surfaces. Adv. Colloid Interface Sci 2011, 162 (1), 87–106. [DOI] [PubMed] [Google Scholar]
- 48.Dickinson E, Adsorbed Protein Layers at Fluid Interfaces: Interactions, Structure and Surface Rheology. Colloids Surf. B Biointerfaces 1999, 15 (2), 161–176. [Google Scholar]
- 49.Malmsten M, Formation of Adsorbed Protein Layers. J. Colloid Interface Sci 1998, 207 (2), 186–199. [DOI] [PubMed] [Google Scholar]
- 50.Sottile J; Hocking DC, Fibronectin Polymerization Regulates the Composition and Stability of Extracellular Matrix Fibrils and Cell-Matrix Adhesions. Mol. Biol. Cell 2002, 13 (10), 3546–3559. [DOI] [PMC free article] [PubMed] [Google Scholar]
- 51.Kadler KE; Hill A; Canty-Laird EG, Collagen Fibrillogenesis: Fibronectin, Integrins, and Minor Collagens as Organizers and Nucleators. Curr. Opin. Cell Biol 2008, 20 (5), 495–501. [DOI] [PMC free article] [PubMed] [Google Scholar]
- 52.Shirahama H; Lyklema J; Norde W, Comparative Protein Adsorption in Model Systems. J. Colloid Interface Sci 1990, 139 (1), 177–187. [Google Scholar]
- 53.Hélary G; Noirclère F; Mayingi J; Migonney V, A New Approach to Graft Bioactive Polymer on Titanium Implants: Improvement of MG 63 Cell Differentiation onto this Coating. Acta Biomater. 2009, 5 (1), 124–133. [DOI] [PubMed] [Google Scholar]
- 54.Green R; Davies M; Roberts C; Tendler S, Competitive Protein Adsorption as Observed by Surface Plasmon Resonance. Biomaterials 1999, 20 (4), 385–391. [DOI] [PubMed] [Google Scholar]
- 55.Tengvall P In Titanium in Medicine: Material Science, Surface Science, Engineering, Biological Responses and Medical Applications; Brunette DM; Tengvall P; Textor M, Thomsen P; Springer-Verlag Berlim Heidelberg GmbH: Berlin, Germany, 2012; Chapter 14, pp 457–483. [Google Scholar]
- 56.Dixon MC, Quartz Crystal Microbalance with Dissipation Monitoring: Enabling Real-Time Characterization of Biological Materials and their Interactions. J. Biomol. Tech 2008, 19 (3), 151–158. [PMC free article] [PubMed] [Google Scholar]
- 57.Tremsina YS; Sevastianov VI; Petrash S; Dando W; Foster MD, Competitive Adsorption of Human Serum Albumin and Gamma-Globulin from a Binary Protein Mixture onto Hexadecyltrichlorosilane Coated Glass. J. Biomater. Sci. Pol. Ed 1998, 9 (2), 151–161. [DOI] [PubMed] [Google Scholar]
- 58.Williams EC; Janmey P; Ferry J; Mosher D, Conformational States of Fibronectin. Effects of pH, Ionic Strength, and Collagen Binding. J. Biol. Chem 1982, 257 (24), 14973–14978. [PubMed] [Google Scholar]
- 59.Hu J; Li S; Liu B, Adsorption of BSA onto Sulfonated Microspheres. Biochem. Eng. J 2005, 23 (3), 259–263. [Google Scholar]
- 60.Martin SM; Schwartz JL; Giachelli CM; Ratner BD, Enhancing the Biological Activity of Immobilized Osteopontin using a Type 1 Collagen Affinity Coating. J. Biomed. Mater. Res. A 2004, 70 (1), 10–19. [DOI] [PubMed] [Google Scholar]
- 61.Galvin N; Vance P; Dixit V; Fink B; Frazier W, Interaction of human thrombospondin with types IV collagen: direct binding and electron microscopy. J. Cell Biol 1987, 104 (5), 1413–1422. [DOI] [PMC free article] [PubMed] [Google Scholar]