FIGURE 1.

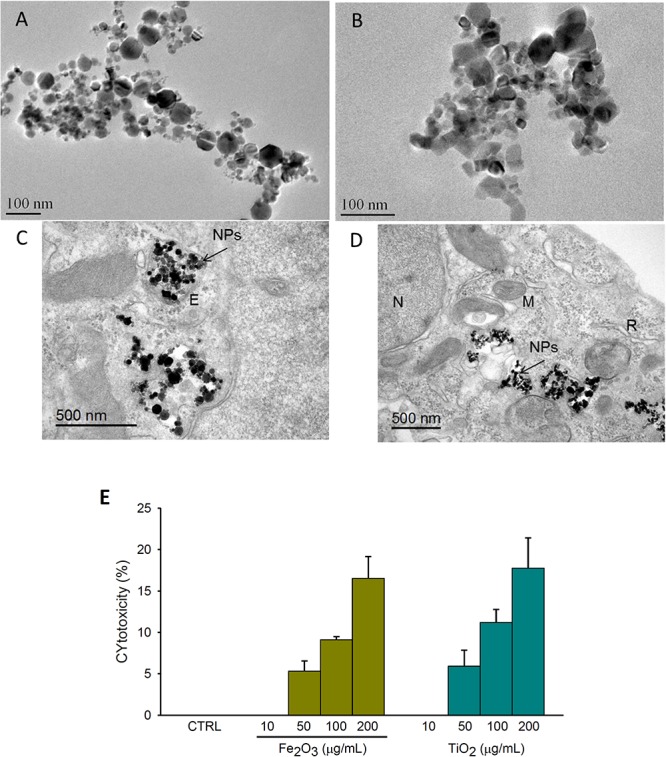
Nanoparticles characterization, internalization and cell viability. Transmission electron microscopy (TEM) images of: (A,B) Fe2O3 and TiO2 aggregates, respectively; (C,D) A549 cell ultrastructure after 24 h-exposure to 10 μg/mL of Fe2O3 and TiO2 NPs, respectively. Note the presence of NPs aggregates trapped in vesicles (C) and also spread in the cytoplasm (D). Lactate dehydrogenase (LDH) release expressed as percentage of cytotoxicity after 24 h-exposure to 10, 50, 100, and 200 μg/mL of Fe2O3 and TiO2 NPs or culture medium (CTRL) in A549 (E). E, endosome; M, mitochondria; N, nucleus; R, rough endoplasmic reticulum. Data are presented as mean ± SE, n = 3.
