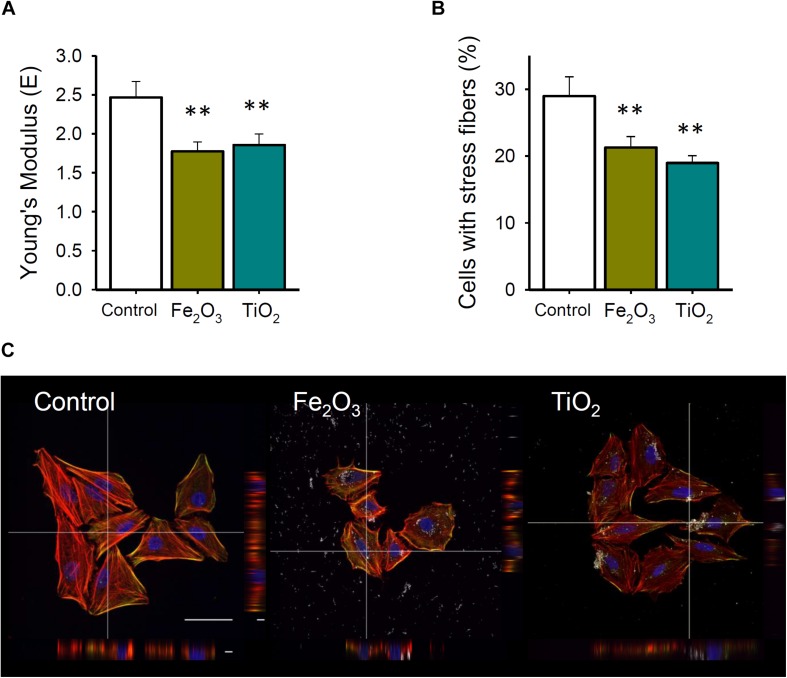
FIGURE 2.
(A) Cell stiffness after 24 h exposure to Fe2O3 and TiO2 (10 μg/mL) NPs or culture medium (CTRL) (n = 11). (B) Percentage of cells presenting actomyosin stress fibers after 24 h of exposure to Fe2O3 and TiO2 (10 μg/mL) NPs or CTRL (n = 6). (C) Examples of F-actin (red) and myosin light chain (green) stained cells. Data are presented as mean ± SE. ∗∗P < 0.01.

