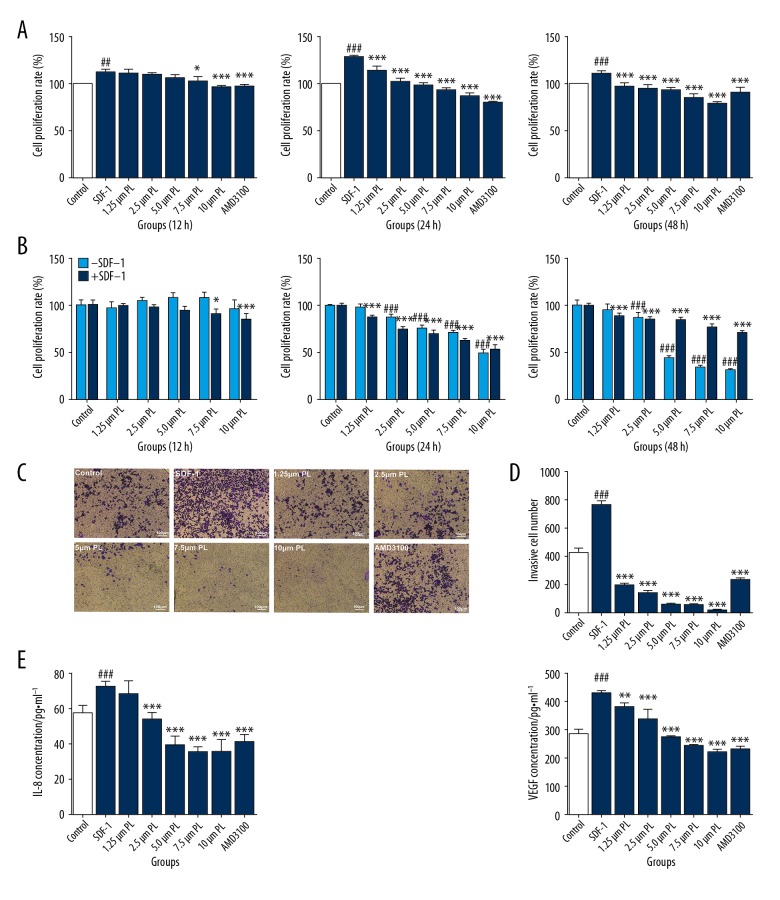
Figure 2.
Cell proliferation of SDF-1 (10 ng/ml)-induced SMMC-7721 cells treated with various concentrations of PL (1.25 μm, 2.5 μm, 5 μm, 7.5 μm, and 10 μm) for 12 h, 24 h, or 48 h in a 5% CO2 incubator at 37°C. AMD3100 (100 ng/mL) was used as the positive control. Each bar represents the mean value ± standard deviation (SD), # P<0.05; ## P<0.01; ### P<0.001, compared to the Control group. * P<0.05; ** P<0.01; *** P<0.001, compared to the SDF-1 group. (A) In the absence of SDF-1, SMMC-7721 cells were treated with different concentrations of PL (1.25 μm, 2.5 μm, 5 μm, 7.5 μm, and 10 μm) for 12 h, 24 h, or 48 h, and their cell proliferation rate was measured. Cells were incubated in a 5% CO2 incubator at 37°C. P<0.05, ## P<0.01; ### P<0.001; Compared with the control group without SDF-1. * P<0.05; ** P<0.01; *** P<0.001, Compared with the control group with SDF-1 (B). Microscopy of invasion of SDF-1-induced SMMC-7721 cells by different concentrations of PL (1.25 μm, 2.5 μm, 5 μm, 7.5 μm, and 10 μm). AMD3100 (100 ng/mL) was used as the positive control (Scale bar, 100 μm) (C). Numbers of invasive cell SDF-1 induced SMMC-7721 cells by different concentrations of PL (D). Effects of different concentrations of PL (1.25 μm, 2.5 μm, 5 μm, 7.5 μm, and 10 μm) on secretion of IL-8 and VEGF in SMMC-7721 cells. AMD3100 (100 ng/mL) was used as the positive control. Each bar represents the mean value ± standard deviation (SD), # P<0.05; ## P<0.01; ### P<0.001, compared to the Control group. * P<0.05; ** P<0.01; *** P<0.001, compared to the SDF-1 group (E).

