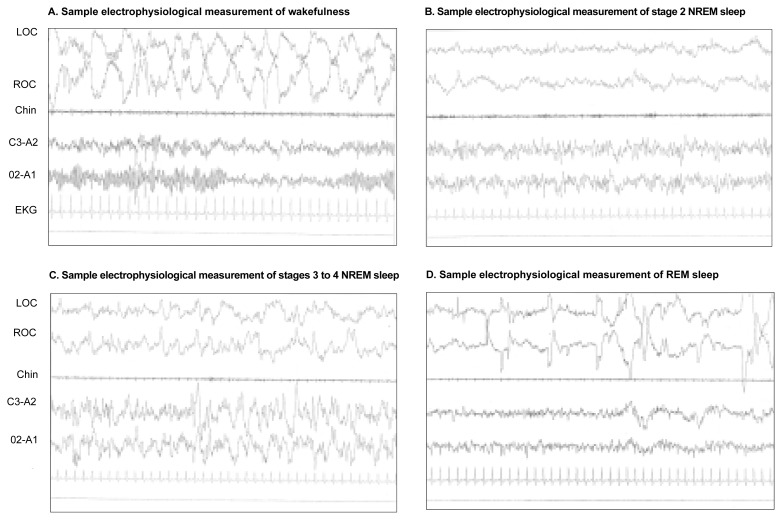
Samples of electrophysiological measurements of various sleep stages. The four panels represent the measurements obtained during (A) wakefulness; (B) stage 2 nonrapid eye movement (NREM) sleep (i.e., light sleep); (C) stages 3 to 4 NREM sleep (deep or slow-wave sleep); and (D) rapid eye movement (REM) sleep, which is associated with dreaming. For each panel, the graphs labeled LOC and ROC represent measurements of the left and right eye movements, respectively. The graph labeled “chin” represents a measurement of small body movements, such as of the chin muscles. The graphs labeled C3-A2 and O2–A1 represent two electroencephalogram (EEG) readings measuring brain activity in certain brain regions. Finally, the electrocardiogram (EKG) measures the heart rate. Each sleep stage is characterized by a specific pattern of those readings. For example, during REM sleep the eyes move rapidly compared with stage 2 NREM sleep. At the same time, the EEG readings during REM sleep exhibit a higher frequency (i.e., number of waves per second) and a lower amplitude (i.e., height of the peaks and valleys of the waves) compared with stage 2 NREM sleep.

An official website of the United States government
Here's how you know
Official websites use .gov
A
.gov website belongs to an official
government organization in the United States.
Secure .gov websites use HTTPS
A lock (
) or https:// means you've safely
connected to the .gov website. Share sensitive
information only on official, secure websites.
