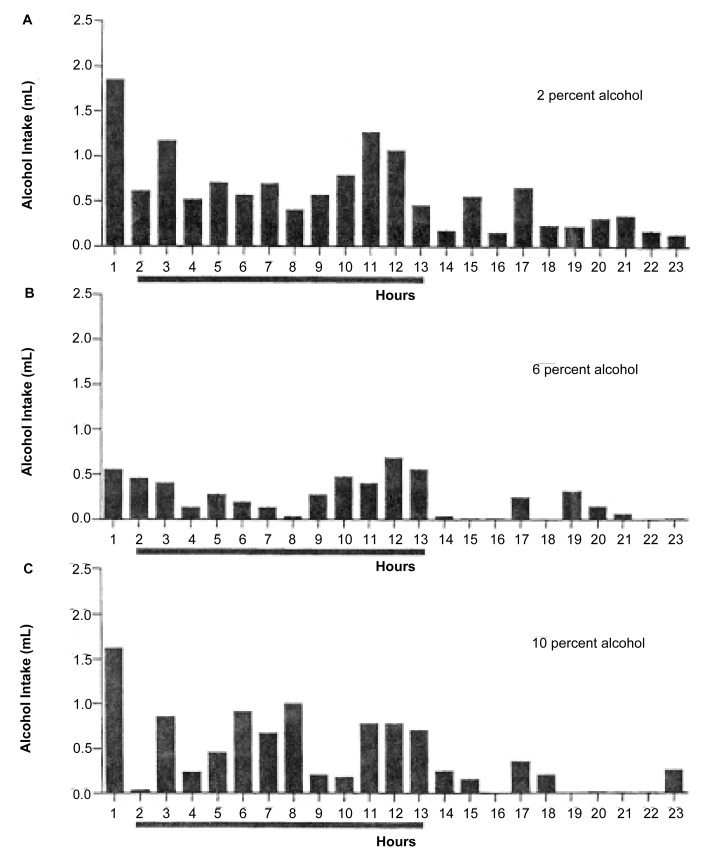
Figure 2.
Alcohol consumption patterns of rats receiving drinking water containing (A) 2 percent, (B) 6 percent, or (C) 10 percent alcohol. The animals had access to the alcohol solution for 23 hours per day. Both overall fluid consumption and circadian consumption patterns differed depending on the alcohol concentration in the drinking water. The horizontal dark line indicates the dark period in the animals’ light-dark cycle. (Error bars are not shown.)
mL= milliliter.
SOURCE: Boyle et al. 1997.

