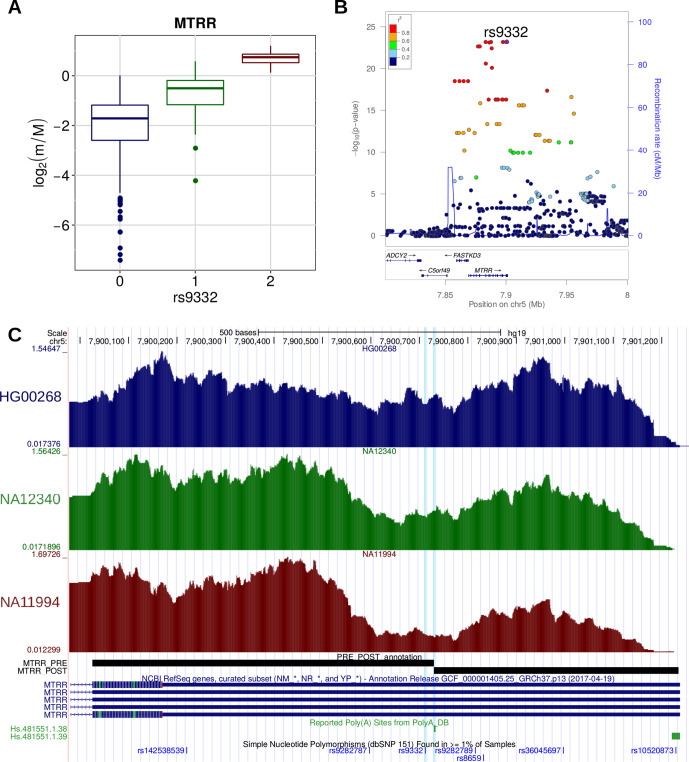
Figure 7.
(A) Boxplot showing the variation of the log2-transformed m/M values obtained for MTRR as a function of the genotype of the individuals for rs9332. (B) LocusZoom plot illustrating the results obtained for MTRR in the genomic region around rs9332 (100 kb both upstream and downstream its genomic location). (C) Figure adapted from the UCSC Genome Browser screenshot. RNA-Seq tracks, reporting coverage per million mapped reads, are shown for three representative individuals: HG00268 (homozygous for the reference allele), NA12340 (heterozygous), and NA11994 (homozygous for the alternative allele). MTRR RefSeq, MTRR PRE/POST segments, poly(A) sites, and common SNPs are shown. The rs9332 variant and the affected poly(A) site (Hs.481551.1.38) are highlighted.

