Fig. 1.
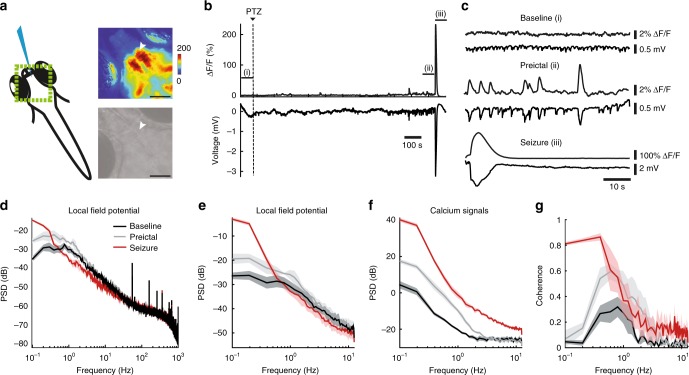
Calcium imaging reliably reports temporal components of neural activity during preictal and generalized seizure period. a Scheme representing simultaneous local field potential (LFP) recording and epifluorescence calcium imaging. Green box indicates the region recorded with calcium imaging. The top right image shows the fluorescence intensity change (ΔF/F) during a seizure, warmer colors indicate stronger activity. The bottom gray scale panel is a raw image of a zebrafish brain (7 days post-fertilization (dpf), Tg(elavl3:GCaMP6s)). White arrowhead indicates the electrode position in the optic tectum. Black bar reflects 100 µm. b Calcium signals (ΔF/F) recorded near the electrode (upper) and electrical activity recorded with the electrode (lower). Dashed line indicates the start of 20 mM pentylenetetrazole (PTZ) perfusion. c Enlargement of the three time windows marked in Fig. 1b. Baseline represents spontaneous activity (prior to drug exposure), preictal period is prior to the onset of the seizure, and the seizure is the first minute following the onset of the generalized seizure. d Power Spectral Density (PSD) of the LFP during the three time windows: baseline (black), preictal (gray) and seizure (red). e PSD of the LFP, decimated to 25 Hz recording rate. f PSD of the ΔF/F calcium signals recorded at 25 Hz. g Magnitude squared coherence between LFP and ΔF/F calcium traces (both at 25 Hz). Shaded regions denote s.e.m., n = 5 fish

