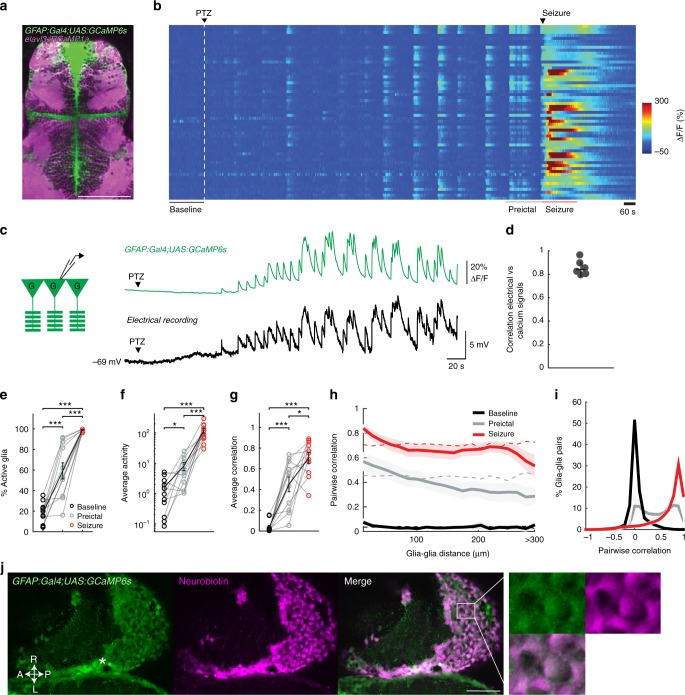
Fig. 4.
Glial cells are highly active and strongly synchronized already during preictal period. a Confocal image of a transgenic zebrafish larvae expressing GCaMP6s in GFAP positive glial cells (green) and jRCaMP1a in elavl3 positive neurons (magenta), dorsal view. b Glial calcium signals measured by two-photon microscopy in Tg(GFAP:Gal4)nw7;Tg(UAS:GCaMP6s) transgenic zebrafish larva. White dashed line indicates the start of 20 mM pentylenetetrazole (PTZ) perfusion. c Simultaneous patch-clamp recording of glial membrane potential and epifluorescence calcium recordings of Tg(GFAP:Gal4)nw7;Tg(UAS:GCaMP6s) transgenic zebrafish, during PTZ-induced epileptic activity. d Correlation of electrical activity and calcium signals from individual glial cells, n = 6 cells/zebrafish. e Percentage of active glial cells (>3stdbaseline) during baseline (black), preictal (gray), and seizure (red) periods. f Average activity of the active glial cells, defined by the area under the curve of the ΔF/F trace. g Average pairwise Pearson’s correlation between glial cells. h Relation between pairwise correlation of glial activity and the distance between each glial pair. Dotted lines represent the results when glial locations are shuffled. i Histogram representing the distribution of the correlation coefficients between glial cells during baseline (black), preictal (gray) and seizure periods (red). j Confocal image showing GFAP positive radial glia expressing GCaMP6s (green) and neurobiotin coupling between glial cells (magenta) after filling a single glia with neurobiotin by patch-clamp electrode. Location of the patch-clamped glial cell is indicated with *. A, anterior; P, posterior; L, left; R, right. White bars reflect 100 µm (a, j). ***p = < 0.001, *p = < 0.05, ns = not significant, Wilcoxon signed-rank test. Error bars and shaded regions represent the s.d. of n = 6 cells (d) or s.e.m. of n = 11 fish (e–i)

