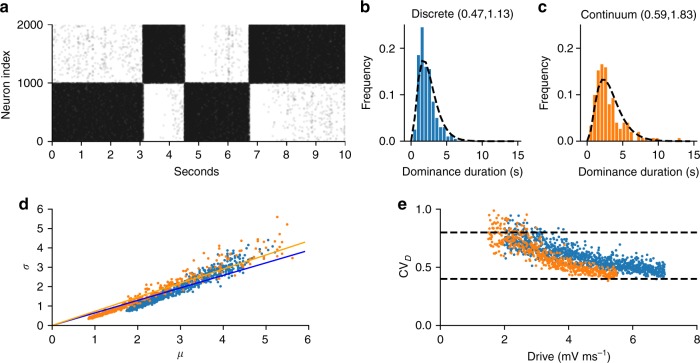
Fig. 4.
Psychophysics variability reproduced by discrete (blue) mutual inhibition and continuum (orange) networks. a Excitatory neuron raster of discrete mutual inhibition network during rivalry showing stochastic dominance durations. b, c Gamma-like distribution of dominance durations with 300 ms report threshold (see Table 1). CVD and skewness, respectively, are given in parenthesis. Dashed lines in b, c are the empirical gamma distribution shape parameter from Robertson et al. during binocular rivalry42 using the scale parameter from our simulations. d Dominance duration standard deviation (σ) vs mean (μ) is well fit by regression line with slope CVD matching Cao et al.28 (discrete slope = 0.65, P-value < 10−314, n = 999 drive strengths sampled; continuum slope = 0.73, P-value < 10−314, n = 500 drive strengths sampled). e CVD computed at each drive strength stays within the experimentally observed range (dashed lines) across changes in drive but has a significant trend (P-value < 10−159, same samples as in d). Statistics (two-tailed P-values, etc.) for descriptive purpose of the modeled system and not rigorous hypothesis tests

