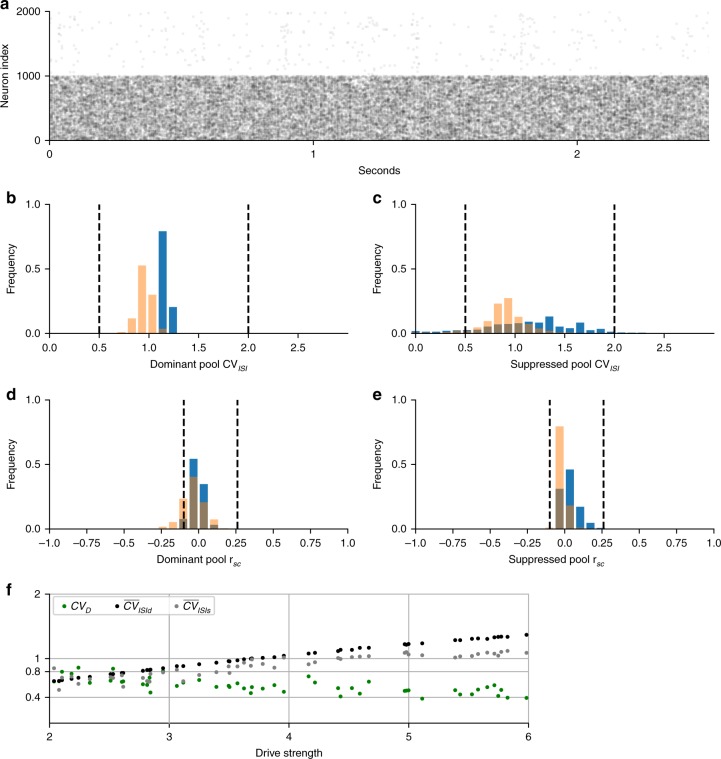
Fig. 5.
Spiking variability in discrete mutual inhibition (blue) and continuum (orange) networks. a–e Results from single realization of example systems (symmetric drive = 5). Distributions are across neurons and dashed lines are empirically observed bounds (see Table 1). a Excitatory neuron raster of discrete mutual inhibition network during rivalry showing stochastic spiking in dominant (neuron index 0–999) and suppressed (neuron index 1000–2000) populations. b, c Irregular spiking shown by the interspike-interval coefficient of variation (CVISI) distributions for dominant pool (b) and suppressed pool (c) excitatory neurons. d, e Asynchronous spiking of dominant pool (d) and suppressed pool (e) excitatory neurons shown by the distribution of spike-count correlations (rsc). f Spiking and perceptual variability as a function of drive strength obeying Levelt’s 4th proposition. Plot of CVD and the average CVISI across neurons in the dominant or suppressed states. There was a significant linear trend for all measures (maximum P-value < 10−8, n = 49 drive strength samples). Measures remained within the empirical constraints as indicated by y-ticks. Statistics (two-tailed P-values, etc.) for descriptive purpose of the modeled system and not rigorous hypothesis tests

