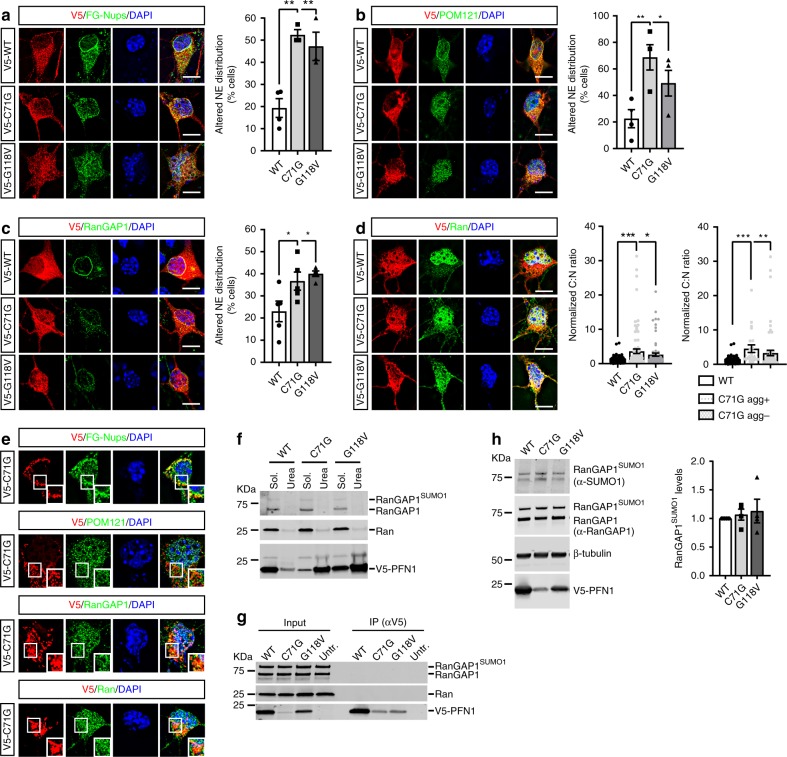
Fig. 1.
Mutant PFN1 alters the composition and density of NPCs. a, c Antibody against FG-Nups (a, green; mAb414), POM121 (b, green), and RanGAP1 (c, green) localization to the NE (identified based on DAPI staining) is altered in a higher percentage of MNs expressing V5-tagged mutant PFN1 vs PFN1WT control (red). d Ran (green) cytoplasm to nucleus (C:N) ratio is increased in MNs expressing V5-WT or mutant PFN1 (red), regardless of the presence of aggregates (agg), indicating possible functional defects in the segregation of cytoplasmic and nuclear proteins. e PFN1C71G -positive cytoplasmic inclusions (red) as described in Wu et al. (2011) in MNs are not positive for FG-Nups, POM121, RanGAP1, or Ran (green), suggesting no co-aggregation under these conditions. f No difference in the solubility of Ran (middle panel) or RanGAP1 (top panel) caused by the expression of PFN1 mutants when assayed in HEK293 cells using detergent-based cellular fractionation. Triton X-100 (2%) and urea (8M) were used to extract the soluble and insoluble fraction, respectively. g Representative blot of a co-immunoprecipitation (co-IP) assay between V5-tagged WT or mutant PFN1 and RanGAP1 (top panel) or Ran (middle panel). No bands were detected in the IP pellet, suggesting lack of interaction. h Representative western blot and quantification showing unchanged levels of SUMO1-modified RanGAP1 in the presence of mutant PFN1. Both antibodies against SUMO1 (top panel) and RanGAP1 (second panel) detect a band ~80 KDa corresponding to SUMOylated RanGAP1. V5 antibody (bottom panel) shows the expression of the V5-tagged PFN1 protein, while β-tubulin was used as a loading control. Bars are mean ± SEM; *p < 0.05, **p < 0.01, ***p < 0.001. N = 3–5 independent experiments (a–c), 76–103 cells from 6 independent experiments (d), 4 independent experiments (h). DAPI (blue) was used to detect the nucleus and assess cell health. Scale bars: 10 µm. See also Supplementary Figs. 1–5, and Supplementary Table 1 for details on statistics

