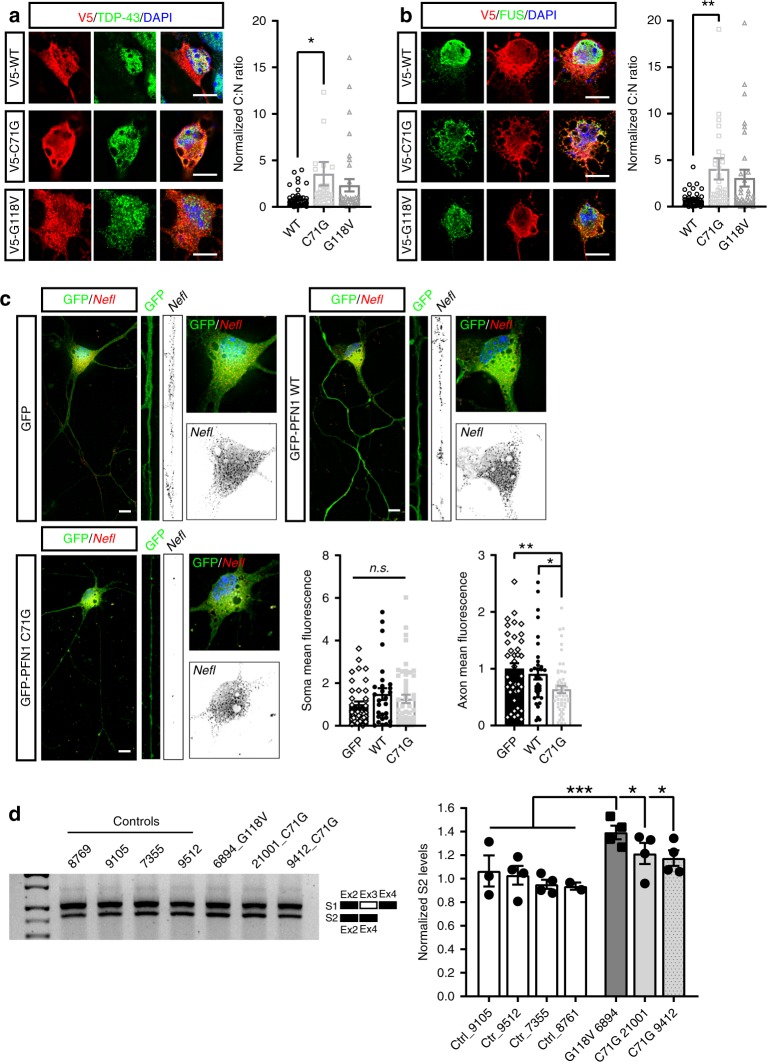
Fig. 5.
Mutant PFN1 perturbs RBPs cellular distribution and function. a, b Mutant PFN1 (red) causes redistribution of nuclear RBPs TDP-43 (a, green) and FUS (b, green) to the cytoplasm, as quantified by their cytoplasm to nucleus (C:N) ratios. c RNA-FISH analysis reveals that the Nefl mRNA (black) levels in the axon, but not in the cell soma, are significantly reduced due to the expression of GFP-PFN1C71G (green) compared to GFP or GFP-PFN1WT-expressing MNs. d Representative DNA gel and quantification of the levels of the POLDIP3 S2 variant over total POLDIP3 levels (S1 + S2) in controls versus mutant PFN1 lymphoblast lines. DAPI (blue) was used to detect the nucleus and assess cell health. Scale bars: 10 µm. Bars are mean ± SEM; *p < 0.05, **p < 0.01, ***p < 0.001. N = 34–47 cells from 3–4 independent experiments (a, b), 29–53 cells from 4 independent experiments (c), 4 independent experiments (d). See also Supplementary Figs. 5–10, and Supplementary Table 1 for details on statistics

