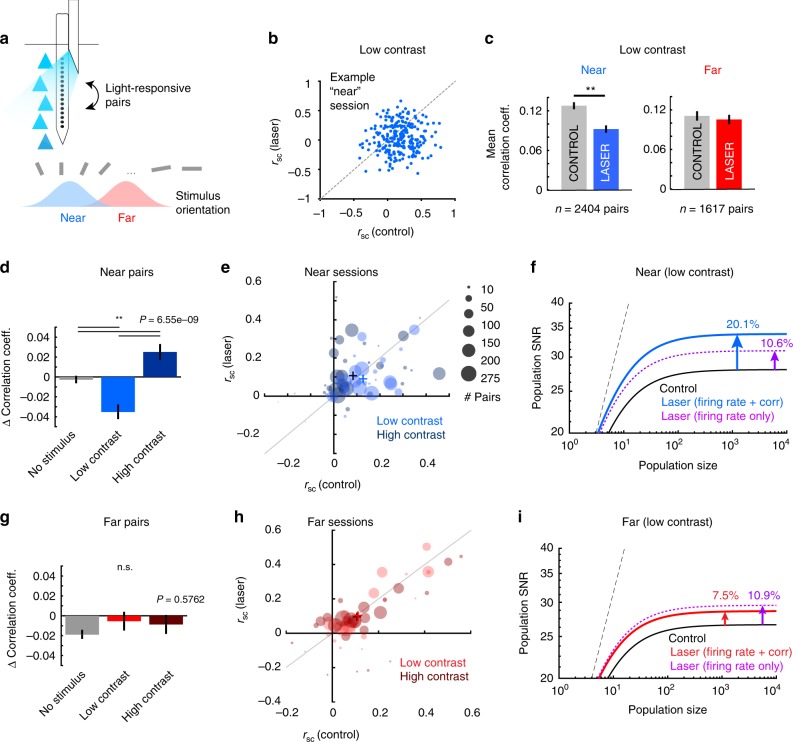
Fig. 4.
Optogenetic stimulation alters noise correlations and network performance in the “near” condition. a Noise correlations between light-responsive pairs along laminar electrode were measured across stimulus conditions. b Changes in noise correlations (“rsc”) for one example “near” condition session, during low contrast stimulus presentation. Each point represents correlation coefficients for one pair of laser-responsive cells in control and laser trials. c Population mean noise correlations for laser-responsive cell pairs during control (gray bars) and laser trials (colored bars) for “near” (left panel, blue) and “far” (right panel, red) conditions during low contrast presentation. (**Near sessions: P = 2.85e-6, Wilcoxon signed rank test, z-statistic = −4.68. Far sessions: P = 0.25, Wilcoxon signed rank test, z-statistic = −1.14). Error bars represent s.e.m. d, g Mean change in noise correlations following optogenetic stimulation for “near” (d) and “far” (g) across all stimulus conditions. Kruskal–Wallis test. Error bars are s.e.m. e, h Mean change in noise correlations for individual “near” (e) and “far” (h) sessions, at low (light circles) and high (dark circles) contrasts. Plus signs indicate cross session pair mean in each condition. Area of circle is proportional to the number of pairs from each session. f, i Impact of noise correlation changes on population SNR. Plots show SNR for hypothetical populations of increasing size for “near” (f) and “far” (i) subpopulations during presentation of low contrast stimuli. Solid lines show the SNR values during the control (black), and laser conditions for “near” (blue, f) and “far” (red, i) activated populations. Dotted magenta lines represent the change in SNR attributable to light-induced increase in firing rates alone, if noise correlations remain unchanged. Dashed black line represents the hypothetical SNR if there was no correlated noise

