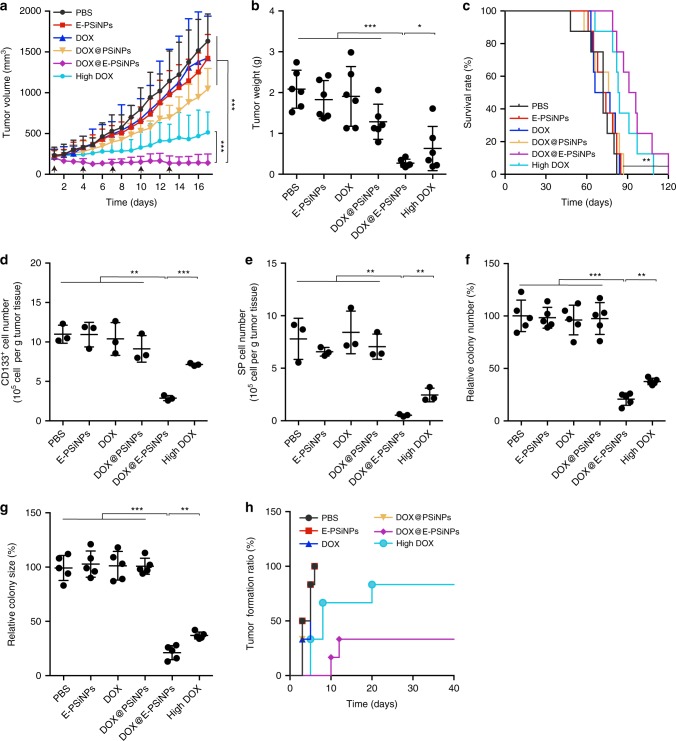
Fig. 7.
Anticancer activity of DOX@E-PSiNPs in H22 tumor-bearing mice. a Tumor growth curves of H22 tumor-bearing mice after intravenous injection of PBS, E-PSiNPs, free DOX, DOX@PSiNPs, DOX@E-PSiNPs exocytosed from H22 cells at DOX dosage of 0.5 mg kg−1, or free DOX at high dosage of 4 mg kg−1. The arrows indicate the drug injection time. Data were represented as mean ± SD (n = 14). b Weight of tumor tissues at the end of tumor growth inhibition experiments. Data were represented as mean ± SD (n = 6). c Kaplan–Meier survival plot of H22 tumor-bearing mice after intravenous administration of different formulations (n = 8). d Number of CD133-postive cells in tumor tissues at the end of tumor growth inhibition experiments. e Number of side population cells in GFP-positive tumor cells of GFP-expressing H22 tumor-bearing mice at the end of tumor growth inhibition experiments as above. Data were represented as mean ± SD (n = 3). f, g Relative colony number (f) and size (g) of tumor spheroids when tumor cells digested from tumor tissues of H22 tumor-bearing mice at the end of tumor growth inhibition experiments were seeded in soft 3D fibrin gels for 5 days. Data were represented as mean ± SD (n = 5). h Tumor formation ratio in BALB/c mice after subcutaneous injection of tumor cells (106 cells per mouse) from tumor tissues of H22 tumor-bearing mice after treatment as above. *P < 0.05, **P < 0.01, ***P < 0.001 (one-way ANOVA with Bonferroni’s multiple comparisons test for a, b, and d–g and log-rank test for c). Source data are provided as a Source Data file

