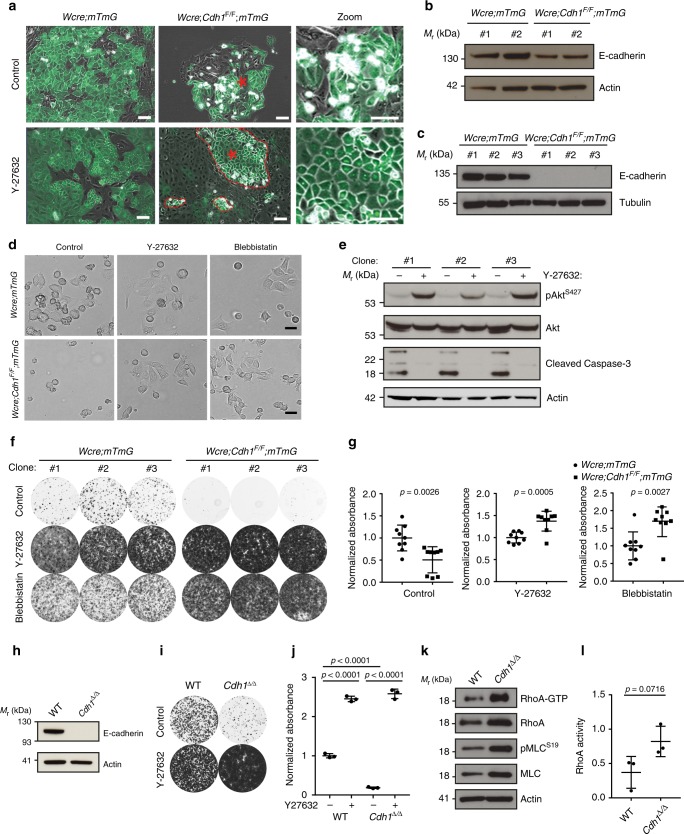
Fig. 3.
Actomyosin relaxation enables survival upon E-cadherin loss. a Merged brightfield and GFP images of MMECs isolated from Wcre;mTmG and Wcre;Cdh1F/F;mTmG female mice in the absence or presence of 10 µM Y-27632. Asterisks indicate areas of zoom, red dotted lines display outgrowth of E-cadherin-deficient MMECs. Zooms display altered cell adhesion in the absence or presence of Y-27632 of GFP-positive E-cadherin-deficient cells derived from Wcre;Cdh1F/F;mTmG female mice. Scale bar, 50 µm. b Western blot analysis of Wcre;mTmG and Wcre;Cdh1F/F;mTmG MMECs stained for E-cadherin and tubulin (loading control). c Western blot analysis of subclones derived from the Wcre;mTmG and Wcre;Cdh1F/F;mTmG MMECs stained for E-cadherin and tubulin (loading control). d Brightfield images of MMECs 3 h post seeding in the absence or presence of 10 µM Y-27632 or 10 µM blebbistatin. Scale bar, 20 µm. e Western blot analysis of pSer473 Akt, Akt, cleaved caspase-3, and actin (loading control) in Wcre;Cdh1F/F;mTmG subclones grown in the absence or presence of 10 µM Y-27632. f, g Representative images (f) and quantification (g) of clonogenic assays with Wcre;mTmG (circles) and Wcre;Cdh1F/F;mTmG (squares) subclones grown in the presence or absence of 10 µM Y-27632 or 10 µM blebbistatin (7 days after seeding the cells). Data are of three independent experiments with three clones per experiment. h Western blot analysis of WT FVB and Cdh1∆/∆ MMECs stained for E-cadherin and actin (loading control). i, j Representative images (i) and quantification (j) of clonogenic assays with Cdh1∆/∆ and WT control MMEC lines with or without 10 µM Y-27632. Data are of three independent experiments. k Representative images of immunoblots of active RhoA pull-down assays and ser19 myosin light chain phosphorylation (pMLC) from Cdh1∆/∆ and WT control MMECs harvested 3 h post seeding. l Quantification of active RhoA pull-down assays by densitometry normalized to the actin loading control. Data are of three independent experiments. All data are depicted as mean ± standard deviation. All p values were calculated using an unpaired two tailed t test. Source data are provided as a Source Data file

