Figure 6.
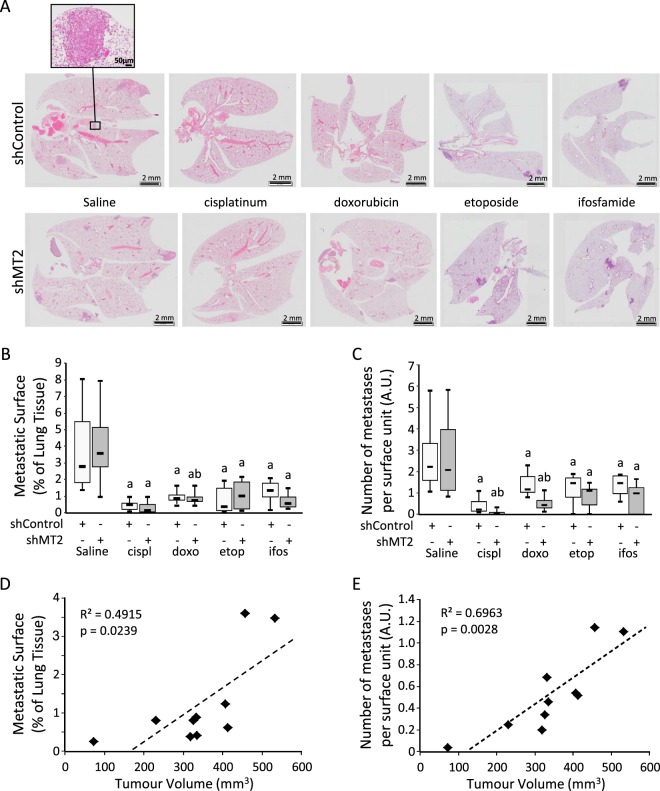
Silencing of MT2 influences chemotherapy tumour pulmonary metastatic dissemination. K7M2 cells modified with shControl or shMT2 were injected intramuscularly into the thighs of SCID mice and administered with chemotherapy as described in the Methods section. (A) H&E staining of lung tissue sections. The scale bars represent 2 mm, except in the upper-left insert: Scale bar = 50 µm. (B) Boxplot specifying the metastatic surface. Results are expressed as percent of whole pulmonary tissue. a indicates a statistically significant difference vs. saline (p < 0.05); b indicates a statistically significant difference vs. shControl group (p < 0.05). (C) Boxplot specifying the number of metastatic nodules per field. a indicates a statistically significant difference vs. saline (p < 0.05); b indicates a statistically significant difference vs. shControl group (p < 0.05). (D) Spearman correlations between the relative metastatic surface, as expressed as percent of whole pulmonary tissue, and tumour volume as expressed as mm3. The black line shows the regression line. The determination coefficient R² and the significance of the F test (P-value) are also given. (E) Spearman correlations between the number of metastatic nodules per field, and tumour volume.

