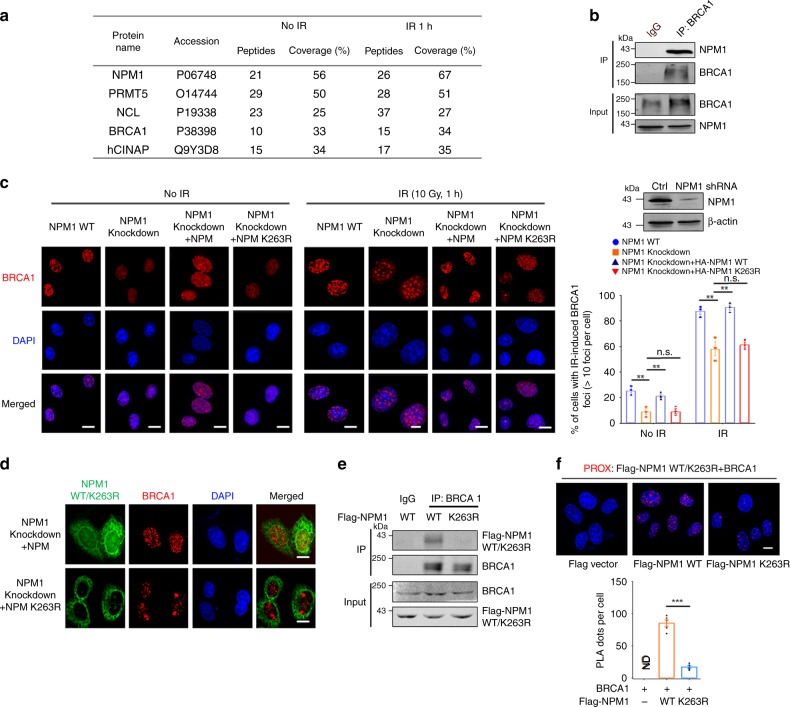
Fig. 4.
NPM1 SUMOylation promotes DSB-induced BRCA1 accumulation. a HEK293T cells harboring the Flag-empty vector or Flag-NPM1 were treated with or without IR (6 Gy) and then lysed and subjected to affinity purification using anti-Flag M2 affinity beads. The purified protein complex was analyzed via mass spectrometry. The major hits from mass spectrometry are shown in the table. b The interaction between NPM1 and BRCA1 was confirmed using a Co-IP assay with the indicated antibodies. c Immunofluorescence assays to analyze the effect of NPM1 SUMOylation on IR-induced BRCA1 foci. U2OS cells with depleted NPM1 were rescued with or without wild-type NPM1 or the NPM1 K263R mutant and treated with or without IR (10 Gy). Representative images are shown and the percentage of cells with more than 10 BRCA1 foci were counted. Scale bar, 10 μm. The results are presented as the mean ± SEM of three biological replicates. Statistical analysis was performed using the Student’s t test; **P < 0.01, ***P < 0.001. Approximately 100 cells in each group were counted. d HeLa cells infected with lentivirus expressing NPM1 shRNA were transfected with wild-type NPM1 or K263R mutant. After transfection, cells were exposed to 6 Gy IR and then recovered for 1 h before being subjected to immunofluorescence using antibodies against NPM1 and BRCA1. Representative NPM1 WT/K263R, BRCA1 foci, and DAPI-stained nuclei are shown. Scale bar, 10 μm. e HEK293T cells transfected with Flag-NPM1 WT or K263R mutant vectors were subjected to co-IP analysis using the indicated antibodies. f U2OS cells transfected with Flag-NPM1 WT or K263R were grown on collagen-coated microchamber slides. After fixation, the interaction between BRCA1 and NPM1 WT or K263R was detected by in situ PLA using anti-Flag and anti-BRCA1 antibodies. The PLA-detected proximity (PROX) complexes are represented by the fluorescent rolling circle products (red dots). Scale bar, 10 μm. Quantification of the PROX dots per cell is shown as mean ± SEM with the P value indicated. ***P < 0.001. The source data can be found in Supplementary Data 1. Unprocessed scans of blots are provided in Supplementary Fig. 13

