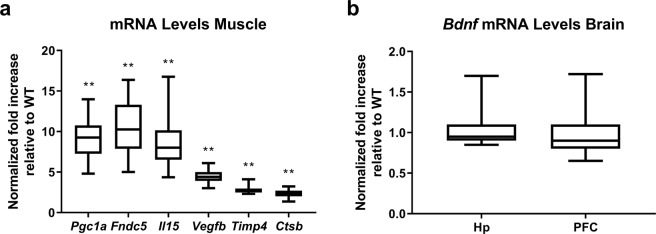
Figure 1.
Validation of PGC-1α overexpression in skeletal muscle. Graph (a) shows relative mRNA levels of Pgc1a, fibronectin type III domain-containing protein 5 (Fndc5), interleukin 15 (Il15), vascular endothelial growth factor B (Vegfb), metalloproteinase inhibitor 4 (Timp4), and cathepsin B (Ctsb), normalized to reference genes 18S and Gapdh (Pfaffl method, resampling test). Image (b) shows relative mRNA levels of Bdnf in hippocampus and PFC, normalized to reference genes 18S, Actb and Tbp (Pfaffl method, resampling test; n.s.). Data expressed as median, with interquartile range as box and minimum and maximum values as whiskers for WT and MCK-PGC-1α animals (n = 5–6; **p < 0.01). Hp, hippocampus. PFC, pre-frontal cortex.

