Fig. 3.
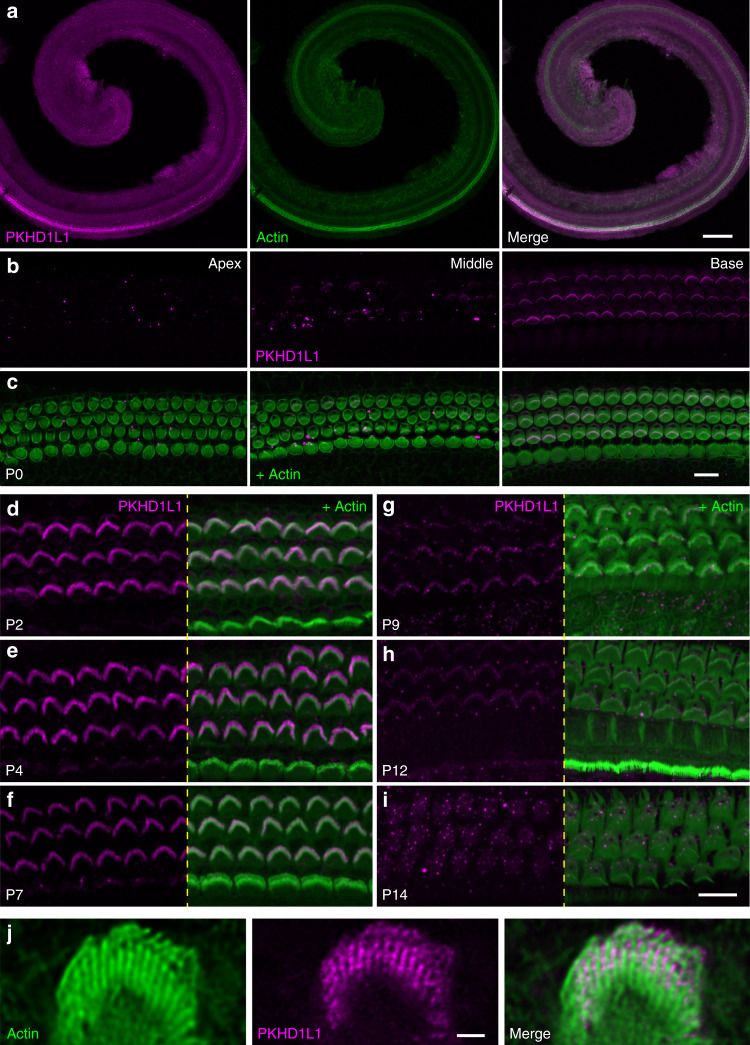
PKHD1L1 protein levels in hair cells of Pkhd1l1fl/fl, Atoh1-Cre− in early postnatal animals. a Confocal images of cochlear whole mounts with anti-PKHD1L1 labeling (magenta), and phalloidin (green; staining filamentous actin) at P0. Note the more abundant anti-PKHD1L1 signal in the base of the cochlea. b, c PKHD1L1 expression levels in P0 cochlea in three locations: apex (left), middle turn (middle), and base (right). c The phalloidin signal (green) is superimposed to visualize stereocilia bundles. d–i Strong anti-PKHD1L1 labeling is evident in OHC stereocilia bundles at P2–P7 d–f, decreasing from P9 to P12 g, h, and no longer detected with fluorescence within the bundles at P14 i. All images were collected from the mid-cochlear location. Anti-PKHD1L1 in magenta, phalloidin in green. j Stimulated Emission Depletion (STED) microscope imaging of PKHD1L1 labeling (magenta) on OHC stereocilia bundles at P7, combined with the phalloidin (green). Scale bars: a, 150 µm; b–i, 10 µm; j, 1 µm

