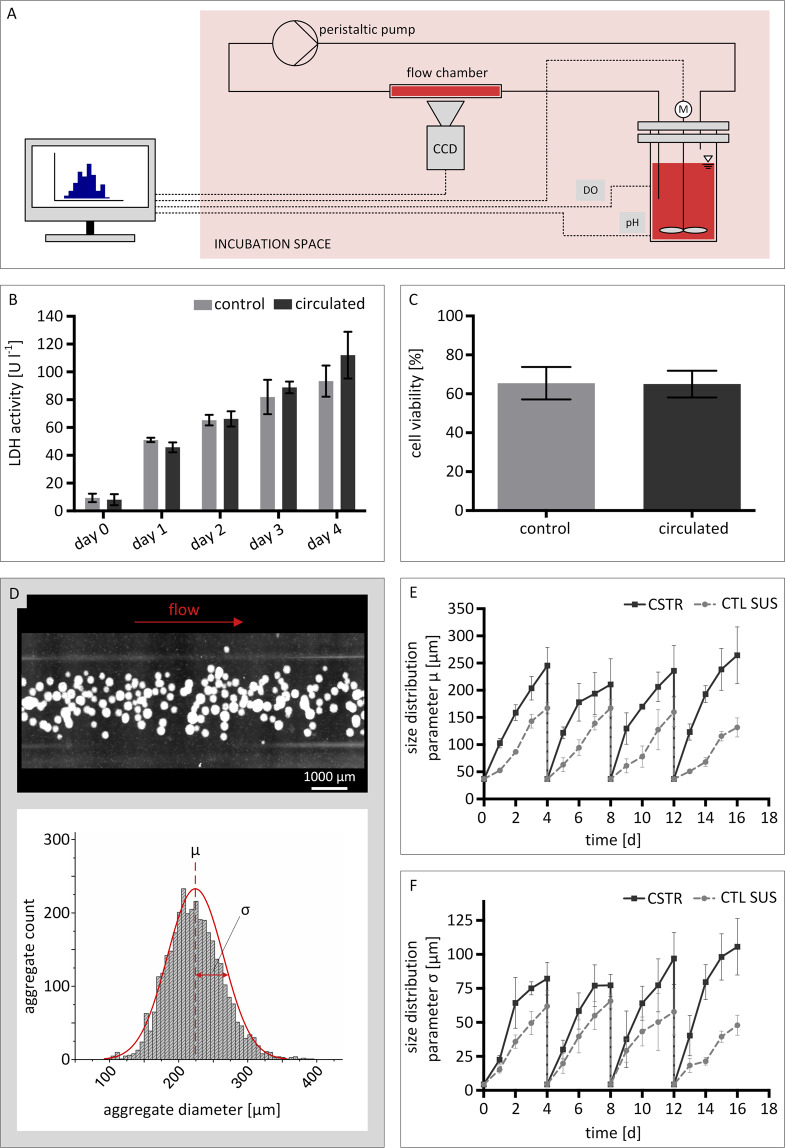
Figure 3.
Automated real-time imaging of human induced pluripotent stem cell suspension cultures. (A) Outline of the cell suspension circulation. Cell suspension was sampled from the reactor by peristaltic pumping and led through a flow chamber above the microscope lens. Images were acquired via CCD camera while the suspension is in flow. A computer was used for at-line image processing, impeller speed control, and pH and oxygen measurement recording. (B) Suspension culture samples were investigated for lactate dehydroxynase activity and (C) cell viability to convey potential cell damage caused by the peristaltic pump during circulation. (D) Processing of suspension culture images provided aggregate size distributions. Here, the mean aggregate diameter µ and its standard deviation σ are used as numerical readout parameters. Automated real-time imaging allowed for detailed characterization of the aggregate formation during bioreactor culture by plotting (E) the average aggregate diameter µ and (F) the standard deviation σ of the aggregate diameter µ as a function of cultivation time. Error bars in all subfigures indicate mean ± SD from n = 3 experiments.

